


Analytical Techniques - Chromatography (A-Level Chemistry)
Chromatography
Chromatography
Chromatography is a separation technique.
As a process, chromatography separates a mixture by dissolving it in a solvent (known as the mobile phase) and passing it through a solid (called the stationary phase).
- Mobile phase – The mobile phase could be a gas or a liquid. It carries any soluble molecules with it as it moves. The greater the affinity (attraction) a molecule in the mixture has in the mobile phase, the faster it will travel.
- Stationary phase – The stationary phase also attracts any molecules with it as the mobile phase moves. The greater the affinity (attraction) the molecule in the mixture has in the stationary phase, the slower it will move with the mobile phase.
With suitable mobile and stationary phases, mixtures of similar molecules can be separated completely. Each molecule in the mixture will have a unique relative attraction for both the mobile and stationary phases.
Chromatography can sometimes be the only method we can use to separate similar molecules.
Types of Chromatography
Chromatography can be carried out in different ways, with different mobile and stationary phases:
- Thin-Layer Chromatography
- Column Chromatography
- Gas-Liquid Chromatography
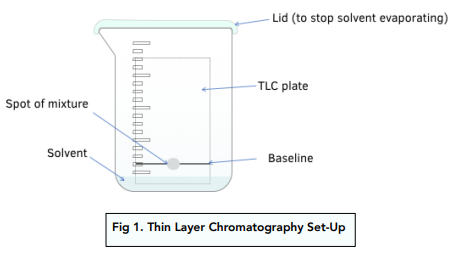
Thin-Layer Chromatography (TLC)
The components of thin layer chromatography or TLC set-up are:
- Stationary phase – Layer of alumina (aluminium oxide) or silica (silicon oxide) gel spread onto a metal, glass or plastic plate.
- Mobile phase – An organic solvent the plate gets dipped into.
A small spot of the mixture under investigation is placed near the bottom of the plate, which then gets dipped into a closed container containing solvent.
The solvent travels up the plate through the stationary phase.
The molecules in the mixture interact differently with the mobile and stationary phases, depending on their relative affinity/attractions to each.
Molecules with more affinity/attraction in the mobile phase will travel faster up the plate.
Molecules with more affinity/attraction to the stationary phase, will travel slower up the plate.
After the plate has run, you can identify the different substances in the mixture by using the position of the spots and calculating Rf values.
Calculating Rf Values
Rf values are a good way to identify each component in the mixture you have just separated. If necessary, use UV light or ninhydrin (a locating agent) to make the spots on the chromatogram visible.
Measure the distance each spot has travelled from the origin line. Measure the distance the solvent has travelled from the origin line.
Then calculate Rf for each spot by:
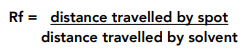
Components can now be identified by comparing the Rf values to known retention factors or Rf values of different components.
Worked example. Identify the Rf value of the unknown substance
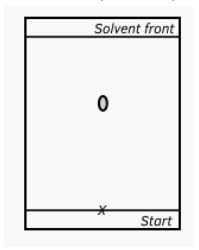
Answer: 0.62
Worked example: A second molecule was added to the mixture in the chromatogram above. It has a lower Rf value. If the stationary phase is polar, and the mobile phase is non-polar, what can you deduce about the relative polarities of the two molecules? (2)
Answer
The second molecule is more polar than the first molecule.(1)
This is because as it has a lower Rf value it is more attracted to the polar stationary phase. (1)
Chromatography is an analytical technique used to separate and identify the components of a mixture. It works by passing the mixture through a stationary phase (e.g. a solid or liquid) and a mobile phase (e.g. a gas or liquid) that move at different rates, causing the components to separate.
The different types of chromatography include gas chromatography (GC), liquid chromatography (LC), thin-layer chromatography (TLC), and high-performance liquid chromatography (HPLC).
Gas chromatography is a type of chromatography that separates volatile compounds in a mixture based on their boiling points and affinity for the stationary phase. It is commonly used to analyze the composition of gases, liquids, and solids.
Liquid chromatography is a type of chromatography that separates non-volatile compounds in a mixture based on their affinity for the stationary phase. It is commonly used to analyze the composition of liquids and solids.
Thin-layer chromatography is a type of chromatography that uses a thin layer of stationary phase (e.g. silica gel or alumina) on a flat surface to separate the components of a mixture. It is commonly used to analyze the composition of organic compounds.
High-performance liquid chromatography is a type of liquid chromatography that uses high pressure to separate the components of a mixture. It is commonly used to analyze the composition of complex mixtures, such as biological samples.
The stationary phase in chromatography is the substance that the mixture is passed through. It can be a solid or liquid, and its properties (e.g. polarity) are chosen to selectively interact with the different components of the mixture.
The mobile phase in chromatography is the substance that moves through the stationary phase, carrying the mixture with it. It can be a gas or liquid, and its properties (e.g. polarity) are chosen to selectively interact with the different components of the mixture.
Retention time is the time it takes for a component of a mixture to travel through the stationary phase and be detected by the detector in chromatography. It is used to identify the component and can be influenced by the properties of the stationary and mobile phases.
A chromatogram is the visual representation of the results of chromatography. It shows the separation of the components of the mixture over time, with each component represented by a peak or band. The height and area of the peaks can be used to quantify the amount of each component in the mixture.
Still got a question? Leave a comment
Leave a comment