


Acids and Bases - Drawing pH Curves (A-Level Chemistry)
Drawing pH Curves
pH Curves
When an acid is added to a base (or vice versa) the pH of the solution changes. A graph of pH against the volume of acid or base is called a pH curve.
Different strengths of acids and bases added together produce pH curves of different shapes.
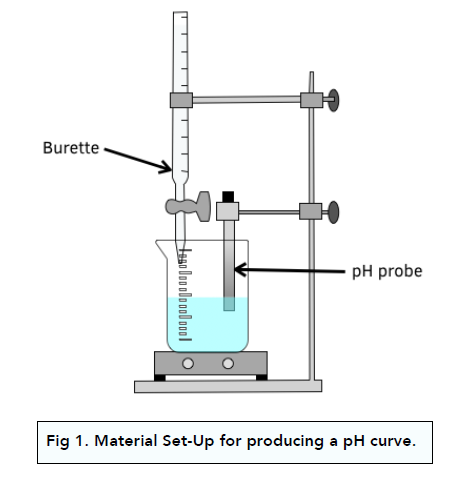
Steps in producing a pH curve
The steps in producing a pH curve are as follows:
1. Calibrate pH meter. Calibrate the pH meter using solutions of known pH.
2. Measure out the acid into a beaker. Use a volumetric pipette and pipette filler to measure the required volume of acid into a beaker.
3. Stir the beaker. Set up a magnetic stirrer to thoroughly mix the contents of the beaker.
4. Add the base to the burette. Fill the burette with the base. Record the initial volume.
5. Add the base slowly. Add 1 cm³ of base to the acid stirring continuously and recording the pH with each addition.
6. Add the base until pH no longer changes. Continue adding base until there is no further change in pH.
7. Plot a pH curve. Plot a graph of pH against volume of base added.
pH Curve: Strong Acid + Strong Base
Strong acids and strong bases are fully dissociated.
The diagram below shows what happens to pH when a strong base is
slowly added to a strong acid:
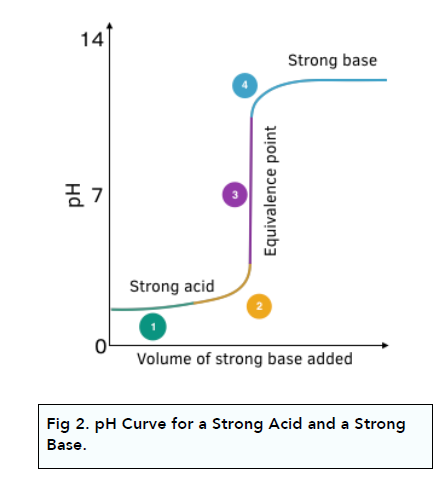
1. The initial pH change is small. When a small volume of base is added, the proportion of H+ ions removed by reaction is small compared to the overall amount of H+ ions, so the pH change is very small to start with.
2. The pH rises faster as more base is added. The rate of change in pH increases as more and more OH- ions are added.
3. There is a sharp rise in pH at the equivalence point. There is a very steep rise in pH with only a very small change in OH- ion volume. At the equivalence point, the H+ ions are neutralised by the OH- ions according to the balanced symbol equation. The equivalence point is the mid-point of the extrapolated vertical portion of the curve. The equivalence point occurs at pH 7.
4. The solution is alkaline after the steep rise. After the vertical section, the solution is alkaline. Any further addition of OH- ions, only has a small impact on pH, as their amount is small compared to the total volume of solution.
pH Curve: Weak Acid + Strong Base
Weak acid is partially dissociated, whereas strong bases are fully dissociated.
The diagram below shows what happens to pH when a strong base is slowly added to a weak acid:
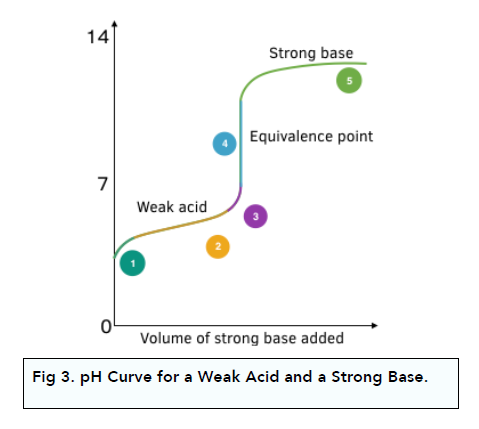
1. The starting pH is higher. As the acid is weak, it starts at a higher pH compared to a strong acid.
2. Initially the pH rises fast. At the start there is a rapid change in pH with a small amount of OH- ions added. The rise becomes less steep as a buffer solution is made (mixture of weak acid and its salt solution). The buffer resists pH changes when further OH- ions are added.
3. There is a steep rise in pH during neutralisation. When neutralisation takes place, there is a steep change in pH with small change in OH- ions.
4. The equivalence point is above pH 7. The equivalence point is greater than pH 7. It is half-way up the vertical portion of the curve.
5. The solution is alkaline after the steep rise. After the vertical section, the solution is alkaline. Any further addition of OH- ions do not have a large impact on pH, as their amount is small compared to the total volume of solution.
pH Curve: Strong Acid + Weak Base
Strong acid is fully dissociated, whereas weak base is partially dissociated.
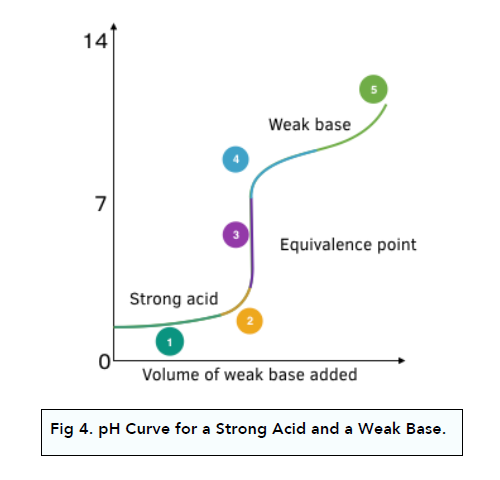
1. The initial pH rise is small. The first part of the graph is the same as that for a strong acid and strong base.
2. There is a steep rise in pH during neutralisation. When neutralisation takes place, there is a steep change in pH with small change in OH- ions.
3. The equivalence point is below pH 7. The equivalence point is lower than pH 7. It is half-way up the vertical portion of the curve.
4. The solution is alkaline after the steep rise. After the vertical section, the solution is alkaline. The rate of pH change is low as basic buffer solution is formed containing a large amount of undissociated weak base molecules and salt ions from the base, which resists pH changes.
5. A steep rise in pH is seen at the end. As the amount of base continues to increase, the buffer is no longer effective and a steeper change in pH is observed.

pH Curve: Weak Acid + Weak Base
Weak acids and weak bases are partially dissociated.
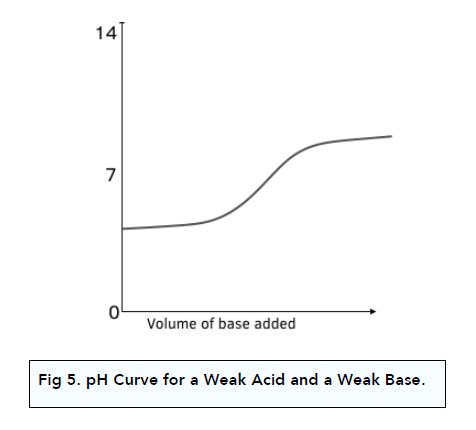
When you add the weak base to the weak acid, there is no clear equivalence point and it is difficult to extract any meaningful information from the curve.
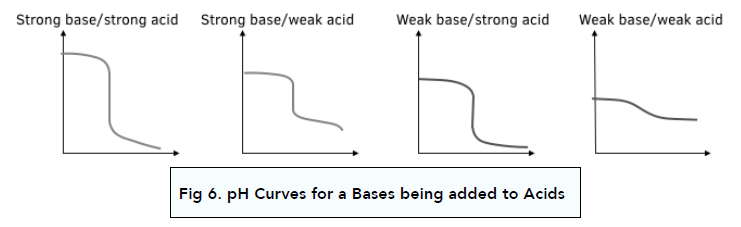
pH Curves with Acid added to Base
All of the diagrams above have involved adding the base to the acid. If the acid is added to the base instead, the shapes of the curves are flipped over as shown.
Using pH Curves and Half Equivalence
When a weak acid has been reacted with exactly half the neutralisation volume of alkali, we can make the assumption [HA] = [A-]. Therefore Ka = [H+] or pKa = pH
Worked Example: Potassium hydroxide solution was added to a solution of 30 cm3 of 0.075 mol dm-3 of butanoic acid at 298 K. The results are shown in the graph
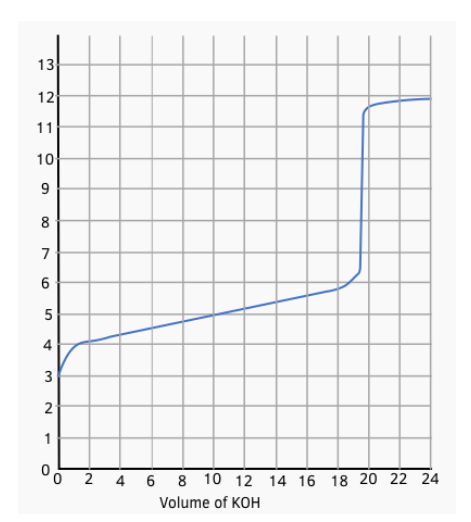
Work out the value of Ka of butanoic acid (3 marks)
Answer:
Step 1: Find the volume of alkali at half equivalence (1 mark)
Use the graph. The equivalence point is half way up the vertical section of the graph.
The volume of KOH at this point = 19.5 cm3
The volume of KOH at half equivalence = 19.5/2 = 9.75 cm3
Step 2: Deduce the pH at the half equivalence point from the graph (1 mark)
At 9.75 cm3, the pH of the solution is 4.90
Step 3: Determine the Ka from the pH (1 mark)
At the half equivalence point, the pH = pKa = 4.90
So Ka = 10-pKa = 10-4.9 = 1.26 x 10⁻⁵
Acids are substances that have a pH lower than 7 and release hydrogen ions (H+) in solution, while bases have a pH higher than 7 and release hydroxide ions (OH-) in solution. The pH scale is used to measure the concentration of H+ ions in a solution and ranges from 0 to 14, with 7 being neutral.
A pH curve is a graph that shows the relationship between the concentration of H+ ions and the pH of a solution. pH curves are commonly used in chemistry to understand the behavior of acids and bases in solution.
To draw a pH curve, a solution of an acid or base is titrated (slowly added to) with a solution of a base or acid of known concentration. The pH of the solution is measured at regular intervals during the titration, and these measurements are plotted on the y-axis of the graph. The volume of titrant added is plotted on the x-axis.
There are several different shapes that a pH curve can take, depending on the type of acid or base being titrated. For example, the pH curve of a strong acid titrated with a strong base will have a steep slope and a sharp inflection point, while the pH curve of a weak acid titrated with a strong base will have a shallower slope and a more gradual inflection point.
Understanding pH curves is important in chemistry because it allows us to understand the behavior of acids and bases in solution, which is crucial in fields such as medicine, environmental science, and industrial processes. By analyzing the shape and behavior of pH curves, chemists can determine the strength and behavior of acids and bases and make predictions about how they will react in different situations.
pH curves can be used in real-world applications to determine the optimal conditions for chemical reactions, to monitor environmental conditions, and to control the pH of industrial processes. In medicine, pH curves can be used to understand the behavior of drugs and other chemicals in the body and to develop treatments for conditions such as acid reflux.
While pH curves are a useful tool for understanding the behavior of acids and bases, they have some limitations. For example, pH curves can only provide a snapshot of the behavior of a solution at a particular moment in time, and may not accurately reflect the behavior of a solution over a longer period. Additionally, pH curves can only provide information about the concentration of H+ ions in a solution, and not other factors that may impact the behavior of acids and bases, such as temperature or the presence of other chemicals.
Still got a question? Leave a comment
Leave a comment