


Atomic Structure - Mass Spectrometry (A-Level Chemistry)
Mass Spectrometer and Relative Masses
- Mass spectrometers are instruments measuring relative masses. Mass spectrometers can measure relative molecular mass (RMM) and relative atomic mass (RAM), alongside relative isotopic abundance.
- There are different types of mass spectrometer. The mass spectrometer we will focus on is the simple time of flight (TOF) mass spectrometer. This spectrometer differentiates molecules based on the time taken for them to travel through the machine.
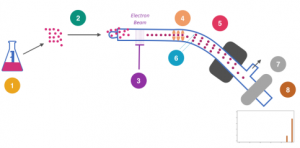
There are 4 main events that occur when a sample enters a TOF spectrometer: ionisation, acceleration, ion drift and detection.
1. Ionisation
- The gas sample is immediately ionised. Before we begin, the sample is vaporised into a gas form. Then, the sample is put into the mass spectrometer, and is immediately k ionised (given a charge). This can happen by one of two methods, as shown below.
- Ionisation can occur using electrospray ionisation. Electrospray ionisation is where voltage is applied, causing each particle to gain an H+ ion. This converts the sample into a gas made up of positive ions.
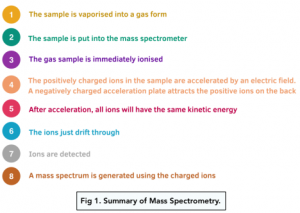
- Ionisation can also occur using electron impact ionisation. This is where an electron gun is used to fire high energy electrons at the particles. The electrons repel a single electron out of each particle, causing them to become charged and forming 1+ ions.
2. Acceleration
- The ions are accelerated by an electric field. Next, the positively charged ions found in the sample are accelerated by an electric field. Acceleration relies on the particles being charged.
- There is often an acceleration plate. The acceleration plate is negatively charged on the front to attract the ions, and positively charged on the back to repel the ions further down the mass spectrometer.
- After acceleration, all ions will have the same kinetic energy. The velocity of a particle depends on its mass and kinetic energy (k.e = 0.5mv2), so the lightest particles will move faster than the heaviest particles.
3. Ion Drift
- Next, the ions just drift through. In the next stage, the electric field is absent, so ions are not deflected and they just pass through. Lighter ions will drift faster.
4. Detection
- In the final stage, the ions are detected. Lighter ions are detected first as they have a shorter drift time compared to heavier ions. The ions are therefore separated based on mass.
- A mass spectrum is generated using the charged ions. For detection to happen, we need the particles to be charged (hence the importance of step 1). The detector uses an electric field to detect the charged ions, and forms a graph called a mass spectrum.
Mass Spectrum
Mass Spectrum Graph
- A mass spectrum shows the data from the spectrometer. The mass spectrum is a graph showing the data obtained.
- The y-axis shows the relative abundance of ions, which is given as a percentage.
- The x axis is the mass/charge ratio. The charge is normally +1, so the ratio is just the mass.
- The type of ionisation changes the spectrum slightly.
- If an electron impact ionisation is used, the mass/charge ratio of the peak equals the relative mass of the isotope (assuming the charge is just +1)
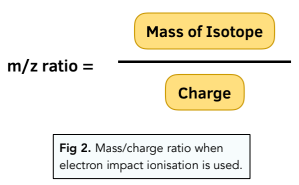
- If electrospray ionisation is used, mass/charge ratio of each peak is one unit greater than relative mass as an H+ ion is added to each particle, hence mass number increases.
Working Out Isotopic Abundance of an Element
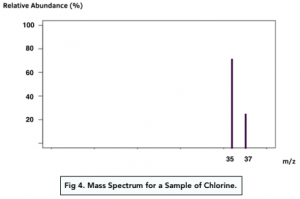
The number of peaks tells you the number of isotopes. On a mass spectrum, each line (peak) represents a particle of a different mass. Isotopes have different masses, so for if you are studying an element (e.g. a sample of chlorine), then each peak will represent a different isotope of chlorine. For example, you may see a peak at 35 and 37 for the two isotopes Cl-35 and Cl-37.
- Some elements have one stable isotope. Some elements just have one isotope. Therefore should just see one peak at the element’s relative atomic mass.
- The height of each peak gives the relative isotopic abundance. The higher the peak, the more abundant that specific isotope is relative to the other isotopes.
Working Out RAM of an Element (using % abundance)
Relative atomic mass can be calculated from the mass spectrum:
- Multiply the relative isotopic abundance (%) on the y-axis by the m/z on the x- axis for each isotope to get total mass.
- Add up the total masses of each isotope, and divide by 100
Example Question 1: Work out the RAM of Boron from this mass spectrum of a Boron sample.
1. Multiply the relative isotopic abundance (%) on the y-axis by the m/z on the x- axis for each isotope to get total mass.
This graph shows the mass spectrum for boron. We can see two peaks, so boron has two isotopes. One isotope has a mass of 10, and another isotope has a mass of 11. Boron-10 seems to have a relative abundance of 22%, which means Boron-11 has a relative abundance of 78%.
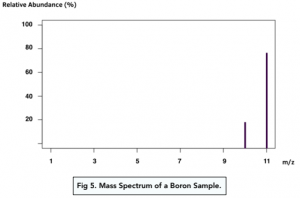
Boron-10 = 22%
Boron-11 = 78%.
All of the atoms of Boron-10 in total will have a mass of: (22 x 10) = 220
All of the atoms of Boron-11 in total will have a mass of: (78 x 11) = 858
2. Add up the total masses of each isotope, and divide by 100
(220 + 858) / 100 = 10.78
Working Out RAM of an Element (using unit abundance)
Sometimes the relative abundance on the y-axis is not give an as a %, but just as a numerical value.
When the relative abundance is in percentages, we know that they will all add up to 100, and hence we divide by 100.
If relative abundances are not given as percentages, you should just divide by the total sum of the relative abundances (instead of dividing by 100). We will look at this example next.
Example Question 2: Work out the RAM of Boron from this mass spectrum of a Boron sample. Notice that the relative abundance is not given as a %.
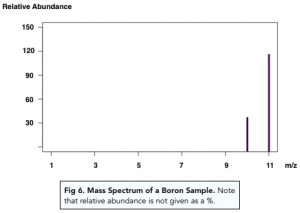
This is the same question as before, but the relative abundance is not given as units. So instead of dividing by 100, we would divide by the sum of the abundances.
1. Multiply the relative isotopic abundance (%) on the y-axis by the m/z on the x- axis for each isotope to get total mass.
Boron-10 = 33
Boron-11 = 117
All of the atoms of Boron-10 in total will have a mass of: (33 x 10) = 330
All of the atoms of Boron-11 in total will have a mass of: (117 x 11) = 1287
2. Add up the total masses of each isotope, and divide by (117 + 33).
(220 + 858) / 150 = 10.78
Identifying Elements
Mass spectrums can be used to identify elements. Each element has its own distinct mass spectrum. When we see a mass spectrum with peaks at 35 and 37, we know it is chlorine.
Diatomic Elements
Some elements are diatomic. For example, chlorine is normally present as Cl2. In the mass spectrometer, the Cl2 ions become ionised to form molecular ions. The ions are quite unstable, so often split up to give Cl
ions.
Therefore the mass spectrum has a mixture of Cl2 molecules and Cl atoms. But, remember that Cl has two isotopes: Cl-35 and Cl-37. This leads to a huge range of peaks:
- A peak at 70 represents a Cl2 molecular ion, made up of two Cl-35
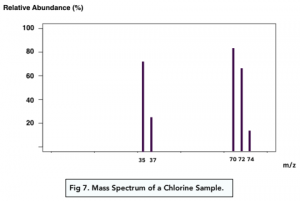
- A peak at 72 represents a Cl2 molecular ion, made up of Cl-35 and Cl-37
- A peak at 74 represents a Cl2 molecular ion, made up of two Cl-37
- A peak at 35 represents a Cl-35 ion
- A peak at 37 represents a Cl-37 ion.
Mass Spectrum of Compounds
Molecules and Relative Molecular Mass
Mass spectrums can identify molecular samples as well. We touched slightly on molecules when we discussed diatomic elements.
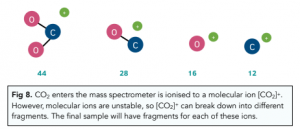
When an electron is removed from the molecule in the sample a molecular ion is formed. A molecular ion is unstable, so often breaks down and loses atoms, forming fragments. Therefore many peaks can be produced.
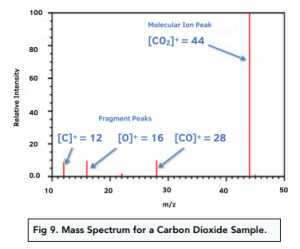
We can determine the relative molecular mass by looking at the peak furthest to the right. The peaks to the left are peaks caused by fragments:
For CO2, for example, the peak furthest to the right is due to the CO2 molecular ion. The peak at 28 is due to the CO molecular ion (an oxygen atom has been lost). The rest of the fragments are shown on the graph below.

Special Mass Spectrometry peaks
When mass spectrometry is used to analyse an compound, there are two peaks you will have to bear in mind:
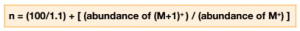
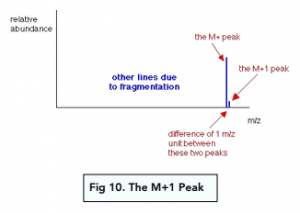
- M +1 Peak – The M+1 peak is a small peak that shows up in a mass spectrum graph for a carbon-containing compound 1 m/z unit to the right if the main molecular ion peak. It is given by C-13 isotopes being detected in the sample and can be used to determine the number of carbon atoms (n) in the sample via the following formula:
- M+ 2 Peak – The M+2 peak is a small peak that shows up in a mass spectrum 2 m/z unit to the right if the main molecular ion peak for compounds containing either chlorine or bromine. This is due to their isotopes and their relative abundances.
- If the M+2 peak is one third of the hight of the main molecular peak, then a chlorine atom is present because the relative abundance of Cl-35 is three times that of Cl-37.
- If the M+2 peak is as tall as the main molecular peak, then a bromine atom is present because both isotopes of bromine have the same relative abundance.
FAQs
Atomic structure refers to the fundamental make-up of an atom, including its electrons, protons, and neutrons.
Atomic mass spectrometry (AMS) is a type of mass spectrometry that is used to determine the elemental and isotopic composition of a sample. Unlike traditional mass spectrometry, which analyzes molecular or ionized species, AMS measures the abundance of individual atoms in a sample.
AMS works by ionizing atoms in the sample and then measuring their mass-to-charge ratio (m/z) as they pass through a mass analyzer. The process typically involves the following steps:
Sample preparation: The sample is prepared in a way that ensures that the atoms of interest are in a suitable form for analysis. This may involve dissolving the sample in a liquid or vaporizing it to a gas.
Ionization: The sample is ionized using a high-energy source such as a laser or plasma. This generates positively charged atomic ions (or negative ions in the case of negative-ion AMS).
Acceleration: The ions are accelerated using an electric field to give them a specific kinetic energy.
Separation: The ions are passed through a magnetic or electric field, which separates them based on their mass-to-charge ratio.
Detection: The separated ions are detected by a detector, which records their mass-to-charge ratio and abundance.
AMS or Atomic Mass Spectrometry is used in a variety of applications, including archaeology, environmental science, and nuclear physics. It can be used to determine the age of archaeological artifacts, to study the migration of pollutants in the environment, and to analyze the isotopic composition of nuclear materials.
A mass spectrometer is a scientific instrument that is used to analyze the mass and structure of molecules and atoms. It works by ionizing the sample of interest and then separating the resulting ions based on their mass-to-charge ratio (m/z).
The basic components of a mass spectrometer include:
Ionization source: This component is used to ionize the sample, typically by bombarding it with high-energy electrons or by using a laser. The ionization process generates charged particles from the sample.
Mass analyzer: This component separates the ions generated from the sample based on their m/z ratio. There are several types of mass analyzers, including magnetic sector, quadrupole, time-of-flight, and ion trap.
Detector: This component detects the separated ions and records their m/z ratio and intensity.
The process of analyzing a sample using a mass spectrometer typically involves the following steps:
Ionization: The sample is introduced into the ionization source, where it is ionized to generate charged particles.
Acceleration: The ions are accelerated using an electric field, which gives them a specific kinetic energy.
Separation: The ions are passed through the mass analyzer, where they are separated based on their m/z ratio.
Detection: The separated ions are detected by the detector, which records their m/z ratio and intensity.
Data analysis: The data collected by the detector is analyzed to determine the composition and structure of the sample.
Mass spectrometry is used in a wide range of scientific fields, including chemistry, biochemistry, and physics. It is used to analyze the composition of complex mixtures, to identify unknown compounds, and to study the structure and function of biomolecules.
A mass spectrometry graph, also known as a mass spectrum, is a graphical representation of the results obtained from a mass spectrometry (MS) experiment. It shows the distribution of ions according to their mass-to-charge ratio (m/z) and their relative abundance.
The x-axis of the mass spectrum represents the mass-to-charge ratio (m/z), which is the ratio of the mass of an ion to its charge. The y-axis represents the relative abundance of the ions, which is usually plotted on a logarithmic scale.
Each peak in the mass spectrum represents an ion with a specific mass-to-charge ratio and abundance. The position of the peak along the x-axis indicates the mass-to-charge ratio of the ion, while the height of the peak indicates the relative abundance of the ion.
The interpretation of a mass spectrum depends on the type of MS experiment performed, the nature of the sample, and the specific ions detected. In some cases, the mass spectrum may be used to identify specific compounds or to determine the elemental or isotopic composition of a sample. In other cases, the mass spectrum may be used to study the fragmentation patterns of molecules or to characterize complex mixtures of molecules.
Mass spectrometry is used in chemistry to identify unknown compounds, determine the molecular weight of a substance, and study the composition of complex mixtures. It is also used to analyze the isotopic composition of elements and monitor chemical reactions.
Mass spectrometry works by ionizing a sample, usually by bombarding it with electrons, and then measuring the mass-to-charge ratio of the resulting ions. This information can be used to determine the molecular weight of the substance and identify its components.
There are several types of mass spectrometry (MS), each with its own strengths and limitations. Some of the most common types of MS include:
Gas Chromatography-Mass Spectrometry (GC-MS): This technique combines gas chromatography with mass spectrometry to separate and analyze complex mixtures of volatile compounds. GC-MS is commonly used in forensic science, environmental analysis, and pharmaceutical research.
Liquid Chromatography-Mass Spectrometry (LC-MS): This technique combines liquid chromatography with mass spectrometry to separate and analyze complex mixtures of non-volatile compounds. LC-MS is widely used in pharmaceutical research, proteomics, and metabolomics.
Matrix-Assisted Laser Desorption/Ionization Mass Spectrometry (MALDI-MS): This technique is used to analyze large biomolecules such as proteins and peptides. The sample is mixed with a matrix material and then irradiated with a laser, which causes the sample to ionize and generate mass spectral data.
Inductively Coupled Plasma-Mass Spectrometry (ICP-MS): This technique is used to analyze the elemental composition of a sample, particularly for trace metal analysis. ICP-MS uses an inductively coupled plasma to ionize the sample, which is then analyzed by a mass spectrometer.
Time-of-Flight Mass Spectrometry (TOF-MS): This technique measures the time it takes for ions to travel from the ionization source to the detector. The ions are accelerated through a field-free drift tube, and the time-of-flight is measured using a detector. TOF-MS is used in proteomics, metabolomics, and imaging mass spectrometry.
Fourier Transform Ion Cyclotron Resonance Mass Spectrometry (FT-ICR MS): This technique uses a magnetic field to trap ions in a cyclotron orbit, which allows for high-resolution mass analysis. FT-ICR MS is used in proteomics, metabolomics, and petroleum analysis.
Mass spectrometry offers several advantages over other analytical techniques, including high sensitivity and specificity, the ability to analyze complex mixtures, and the ability to study both organic and inorganic compounds. Additionally, mass spectrometry can be performed in real-time, making it useful for monitoring chemical reactions.
In A-Level Chemistry, mass spectrometry is often used to reinforce concepts related to atomic structure and the behavior of ions. Students may also use mass spectrometry to study real-world examples of chemical reactions and to perform experiments to identify unknown compounds.
Still got a question? Leave a comment
Leave a comment