


Concentrations of Solutions (GCSE Chemistry)
Concentrations of Solutions
Concentration of a Solution
- We can define the concentration of a solution. The concentration of a solution can be measured in mass per given volume of solution.
- Concentrations have dissolved solutes. We could measure the grams of a substance that are dissolved in 1dm3 of a solution to give a concentration.
- Concentration has units. The unit grams per dm3 (g/dm3) is the unit used to measure the concentration of a solution.
Concentration, Mass and Volume
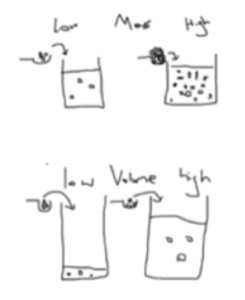
- Concentration is affected by mass and volume. Mass and volume can both affect concentration differently.
- Increased mass means a higher concentration. Concentration is proportional to the mass of a substance. This means that the higher the mass of the solute, the higher the concentration, for a given volume.
- Increased volume means a lower concentration. Concentration is inversely proportional to the volume of the solute. This means that the higher the volume, the lower the concentration, for a given mass.
- Particles are linked to volume. Imagine if we took the same amount of particles and added them to a small volume and a large volume. The smaller volume will have a higher concentration of particles, since there is less space for them to move. The larger the volume, the more space the particles have to move, so you have a lower concentration.
Uncertainty
Measurements always have some uncertainty. When we make measurements in Chemistry, there is always a level of uncertainty about the results that we get.
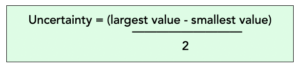
We can measure uncertainty. When performing an experiment, its really important to estimate uncertainty. We can do this by using a simple formula:
We can reduce uncertainty. Although we cannot completely remove uncertainty, we can try and reduce it. In order to do this, we need to take lots of readings in our experiment and perform repeat our results.
We can draw graphs to represent results. Once we’ve finished an experiment, we can draw graphs or bar charts to represent our results. These can also give a visual representation of how the data is distributed.
Still got a question? Leave a comment
Leave a comment