Graphs to Calculate Rates of Reaction (GCSE Chemistry)
Representing Rates of Reaction
- Graphs can represent rates of reaction. We can draw a graph of product (or reactant) against time in order to represent the rate of reaction. The gradient of the graph will be the rate of reaction. The steeper the gradient, the faster the rate of reaction.
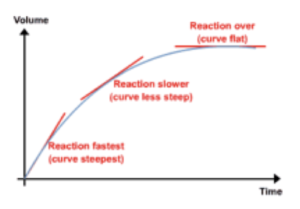
- Mean rate of reaction can be calculated. If we work out the overall change in y value (i.e. product formed or reactants used up) then divide by the total time taken for the reaction, we can calculate the mean rate of reaction.
Worked Example
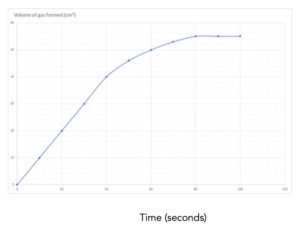
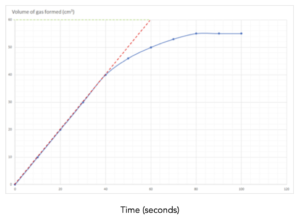
Practice Question 1: The graph below shows the volume of a gaseous product formed during a reaction. Find the mean rate of reaction.
Answer:
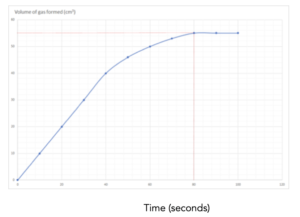
1.Identify the values on the graph. Identify the final volume of gas made from the graph, and the final time taken to make this volume. This is shown by the lines in red. The final volume = 70 cm3 and the time taken to make this volume is 80 seconds.
2. Write out the equation. Now, we can write out the equation to calculate a value for the rate of reaction.
Mean rate of reaction = overall change in volume/change in time
3. Substitute in the numbers. Now that we have identified the correct equation, we can substitute in our numbers.
Mean rate of reaction = (70)/(80)
Mean rate of reaction = 0.875 cm3/s
Calculating Rate of Reaction at Specific Times
- Rate at the start or initial rate of reaction. The graph of change in product over time or change in reactant over time can be used to find the rate at the start of the reaction. The initial rate is the highest rate on the curve. The reactants have the highest concentration at the start and so the maximum number of collisions are taking place.
- Calculating rate of reaction at the initial rate. The rate at the start of the reaction can be calculated by drawing a tangent to the curve at time = 0 and finding the gradient of the tangent.
- Drawing a tangent. The tangent is a straight line which touches the curve at the point of interest only. The gradient of the tangent = the gradient of the curve at that point. To find the gradient, make sure the tangent line is as large as possible to calculate a more accurate gradient.
Worked Example
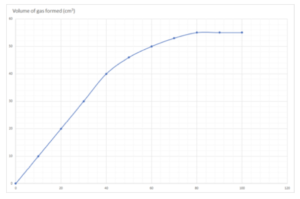
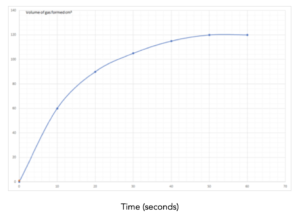
Practice Question 2: The graph below shows the volume of a gaseous product formed during a reaction. Find the initial rate of reaction.
Answer:
- Draw a tangent to the curve at time = 0. This is the line drawn in red.
- Make the tangent as large as possible.
- Calculate the gradient of the tangent = change in y/change in x
- This equals the initial rate.
Gradient = change in y/change in x = 60/ 60 = 1 cm3/s
- Calculating Rate of reaction at a specific time. To calculate the rate of reaction at a specific time:
- Draw a tangent to the curve at the time required.
- Make the tangent as large as possible.
- Calculate the gradient of the tangent.
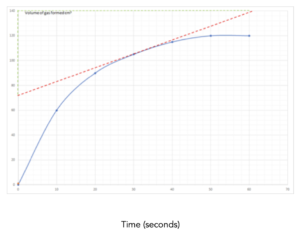
Practice Question 3: This graph shows the volume of a product formed during this reaction. Work out the rate of reaction at 30 seconds of this reaction.
Answer:
1.Identify the values on the graph. In this question, we need to calculate the rate of reaction at a certain point during the reaction. First, we need to identify the 30 second mark on the graph.
2. Draw a tangent. To find the rate of reaction at 30 seconds, we must draw a tangent at this specific point. See line drawn in red on the graph.
To draw the tangent place a ruler on the paper until the space between the ruler and the curve are the same on both sides.
Then draw a line across the whole of the graph.
3. Calculate the gradient. After drawing the tangent, pick 2 easy to read points on either side of the line. From these points, we can calculate the gradient as we did above. See lines drawn in green on the graph.
4. Write out the equation. Now, we can write out the equation to calculate a value for the rate of reaction.
rate of reaction at 30 seconds = change in volume /change in time
5. Substitute in the numbers. Now that we have identified the correct equation, we can substitute in our numbers.
= (140-72)/(61-0)
= 1.11 cm3/s
FAQs
The rate of reaction is the speed at which a chemical reaction takes place. It is usually measured in terms of the change in concentration of a reactant or product per unit of time.
Graphs are a useful tool for calculating the rate of reaction because they can visually represent the relationship between variables such as time, concentration, and rate.
To plot a graph to calculate the rate of reaction, you need to select two variables, such as time and concentration, and plot them against each other. The slope of the line represents the rate of reaction.
The rate of reaction is directly proportional to the slope of the graph. A steeper slope indicates a faster rate of reaction, while a shallower slope indicates a slower rate of reaction.
Yes, you can use graphs to determine the order of a reaction. The order of a reaction refers to the power to which the concentration of a reactant affects the rate of reaction. This can be determined by observing the relationship between the rate of reaction and the concentration of a reactant on a graph.
The integrated rate law is an equation that relates the rate of reaction to the concentration of a reactant over time. It can be used to determine the half-life of a reaction, which is the time it takes for the concentration of a reactant to decrease to half its initial value.
Understanding rates of reaction and how to calculate them is important because it helps to explain the behavior of chemical reactions and can be used in various industrial and technological applications, such as the optimization of chemical processes.
The rate of a chemical reaction is defined as the change in the concentration of a reactant or product with time. It can be expressed in terms of the rate of disappearance of a reactant or the rate of appearance of a product. The rate of a reaction can be calculated using the following equation:
Rate of reaction = Δ [A] / Δt
where Δ [A] is the change in the concentration of reactant A over a small time interval Δt. This can be determined by measuring the initial and final concentrations of A and calculating the difference.
The units of rate of reaction depend on the order of the reaction. For a first-order reaction, the rate is expressed in units of 1/time (e.g., s^-1), while for a second-order reaction, the rate is expressed in units of volume/time (e.g., L/mol*s).
It’s important to note that the rate of a reaction can be affected by various factors, such as temperature, concentration, pressure, and the presence of a catalyst. These factors can be analyzed using the rate law equation, which gives the dependence of the rate on the concentrations of the reactants and any catalysts.



Still got a question? Leave a comment
Leave a comment