


Calculating Genetic Diversity (A-level Biology)
Calculating Genetic Diversity
Comparative Genomics
So far we have looked at the grouping of organisms into taxonomical groups and the study of evolutionary relationships. Both of these involve looking at the diversity between and within species.
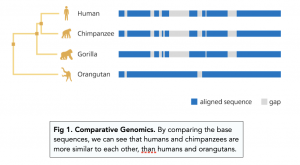
We touched earlier on how we can use gene sequencing to understand evolutionary relationships (comparative genomics). Comparative genomics enables us to understand the diversity of genes present within a population or community, and how these genes change over time in order to understand evolution and evolutionary relationships.
1. Observable and Measurable Characteristics
We can deduce similarity between organisms by looking observable characteristics such as facial features, body shape and bone structure.
We can also look at measurable characteristics such as weight, height and blood pressure.
2. DNA Sequences
- New techniques enable rapid sequencing of whole genomes. Using novel biotechnological breakthroughs such as ‘Next Generation Sequencing’, we have been able to rapidly sequence the genomes of many organisms – i.e. determine the whole base sequence.
- We can compare the DNA of different organisms. By comparing the DNA sequences between species, we can determine how related organisms are. The degree of similarity between the sequences tells us (to an extent) the degree of similarity between the species, and even organisms within the same species.
- We compare by aligning DNA. By aligning the DNA of one species to another, we can determine how similar the base DNA sequence is.
3. mRNA Sequences
- Exon sequences are similar between organisms. As we just discussed, the underlying base DNA sequences of different genes may be very different, making DNA comparison slightly ineffective. However, most genes have similar exon sequences, so we can compare them instead.
- We can analyse axons on mRNA. Because mRNA only has exons, it is useful to compare alignments of mRNA to see the similarity between organisms.
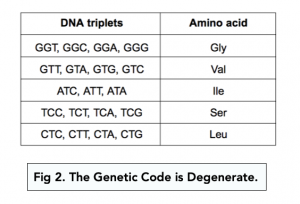
- BUT, there are still limitations in mRNA comparison. Similar to DNA, mRNA sequences between different organisms for the same gene can be quite different due to the degenerate nature of the genetic code.
4. Amino Acid Sequences
- There are limitations of DNA comparison. When comparing evolutionary relationships, we compare genes (DNA). However, the sequences of the genes, as we have learned, can be very different.
- Amino acid sequences vary less between organisms. Despite the degenerate nature of the genetic code, the amino acid sequences of most proteins across various organisms are very similar.
- We can compare the function of proteins in different organisms. When making evolutionary relationships, we want to determine if the function of a protein in one species is conserved in another species. And in order for the function to be conserved, so must the structure.
- We can align and compare amino acid sequences. Comparative alignments of amino acid sequences of proteins from different species are the best tool for determining evolutionary relationships. More closely related organisms have more similar amino acid sequences.
Example Question:
What conclusions can you make about 4 organisms (A,B,C,D) from the following statements.

- Organism A and Organism B have 66% similarity in DNA sequence.
- Organism A and Organism C have a 88% similarity in amino acid sequences.
- Organism A and Organism D have a 55% similarity in amino acid sequence.
We cannot say that Organisms A and B are less closely related than Organisms A and C due to the degenerate nature of the genetic code. A and B could have 90% similarity in amino acid sequence – we do not know!
We can confidently predict that Organisms A and B are more closely related than A and D. The % similarity in amino acid sequence for A and B is very likely to be greater than 66% due to the degenerate nature of the code.
Quantitative Analysis in Investigating Diversity
1) Collecting Data from Random Samples
- Scientists use sampling to study populations. When scientists study a particular population, it usually isn’t possible to study every part of the population. Instead, they study a sample.
- Sampling needs to be random. Sampling is ideally done randomly in order to minimise biases. You can split a field into a grid, and use an online calculator to randomly generate a co-ordinate.
- Sample sizes need to be large. The larger the sample size of an experiment, the more significant the data that is yielded.
- Sample techniques should be tailored. In order to obtain accurate results from your investigations, sampling techniques should be tailored to the organisms that you are investigating. For example, you could use a Tullgren funnel to sample small insects living in soil.
- Sometimes sampling can be non-random. If there is a there is a large variety in the way a species is distributed in a habitat, sometimes you may need to take a ‘non-random’ sample. Systematic, opportunistic or stratified are the three types of non-random sample.
2) Calculating Mean and Standard Deviation
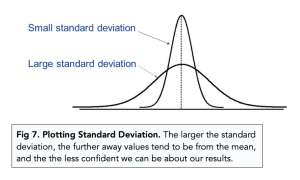
- We often plot continuous variation on a normal distribution. A normal distribution graph allows us to visualise how spread out or distributed our data points are.
- We can work out the mean. Normal distributions have most values closest to the mean (centre). This is the peak on the graph. The mean is the total of all values / the number of values.
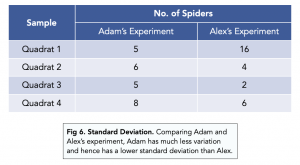
- We can work out the standard deviation of the mean. The standard deviation is a measure of how spread out the data is around the mean. We can determine the percent of our sample that was measured above the mean, and the percent that was measured below the mean.
3) Interpreting the Mean and Standard Deviation
When drawing conclusions from a study, we need to measure how significant the difference is between our samples. In most cases we compare the means of our samples to see how different they are.
Using a statistical test, we can calculate confidence levels for the differences between our means. If the calculated confidence levels fall within a range of 95% or greater confidence levels, we assume the differences between our means are significant.
Still got a question? Leave a comment
Leave a comment