


Vector Diagrams (GCSE Physics)
Vector Diagrams
Using Vector Diagrams
Determining Horizontal and Vertical Forces
We can use vector diagrams to help us resolve forces into a vertical and horizontal component. Vector diagrams represent forces as vectors, which have both magnitude and direction.
In the exam, they’ll give you a scale (e.g. 1cm = 10N) so that you can measure distances and correlate them to force.
Question: There are two forces acting on an object, one horizontal (4N) and one vertical (7N). The forces are perpendicular to each other. What is the size of the resultant force? (2cm = 1N)
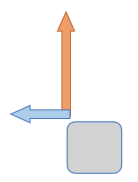
- Draw the horizontal and vertical forces. Draw the horizontal and vertical forces in a vector diagram. When you draw the components, use a vector – i.e. the magnitude of the vector will be the size of the force and the direction of the vector will be the direction of the force. For example, the 3N vertical force would be 6cm according to the scale given in the question.
- Work out the resultant force. The resultant force is the hypotenuse between the vertical and horizontal forces. However, from the diagram we can see the direction will be in between the horizontal and vertical forces, so we have to re-arrange our triangle, as shown in the diagram below.
- Use a ruler to measure the resultant force. Measure the length of the vertical force.
You can also do this process backwards to work out the resultant force if you are given the horizontal and vertical components.
FAQs
Vector diagrams are visual representations of physical quantities, such as force or velocity, that have both magnitude and direction. The magnitude of a vector is represented by the length of the arrow, and the direction is indicated by the direction the arrow points in.
Vector diagrams are used in physics because they provide a simple and effective way of representing physical quantities that have both magnitude and direction. By using vector diagrams, complex physical interactions can be easily visualized and analyzed.
Vector diagrams are used to represent forces by drawing arrows that represent the magnitude and direction of each force acting on an object. The vectors are drawn to scale and are added together to find the net force acting on the object.
Vector diagrams are used to represent velocity by drawing an arrow that represents the magnitude and direction of an object’s velocity at a particular moment in time. The length of the arrow represents the speed of the object, while the direction of the arrow represents the direction the object is moving in.
The net force or net velocity from a vector diagram can be found by adding the individual vectors together. This is done by placing the tail of each vector at the head of the previous vector, and then drawing a vector from the starting point to the end point. The length of the resulting vector represents the magnitude of the net force or net velocity, and its direction represents the direction of the net force or net velocity.
Vector addition is the process of combining two or more vectors to find the net vector. It is important in physics because it allows us to calculate the net effect of multiple forces or velocities acting on an object, which is essential for understanding the motion and behavior of objects.
Yes, vector diagrams can be used to represent other physical quantities besides force and velocity, such as acceleration, displacement, and momentum. The magnitude and direction of the vector represent the magnitude and direction of the physical quantity being represented.
Vector diagrams can be used to analyze the motion of objects by representing the net force acting on an object and the object’s velocity. By using vector diagrams, it is possible to understand the relationship between the net force acting on an object and its acceleration, and between its velocity and its displacement.
Scalar quantities are physical quantities that have only magnitude, such as mass or time. Vector quantities are physical quantities that have both magnitude and direction, such as force or velocity. Vector diagrams are used to represent vector quantities, while scalar quantities are typically represented by numerical values.
Still got a question? Leave a comment
Leave a comment