


Current-Voltage Graphs (GCSE Physics)
Current-Voltage Graphs
Ohm’s Law
Ohm’s Law is a special relationship between current and potential difference of a component.
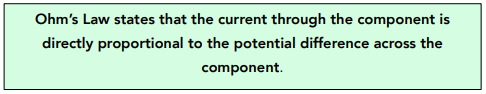
In simple terms Ohm’s Law is saying that if resistance is constant, then the value of the current depends on the potential difference (voltage). This makes sense if we look back at the equation V = IR.
For Ohm’s Law to hold true, there needs to be a constant temperature, because changes in temperature can lead to changes in resistance (and therefore we would no longer have a constant resistance).
Ohm’s Law gives us the characteristic straight line graph that we saw in the experiment in the previous tutorial.
Current-Voltage Graphs
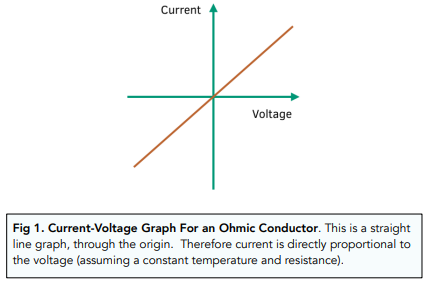
Graph of Ohmic Conductor
An Ohmic conductor is one that obeys Ohm’s Law. As previously mentioned, Ohm’s Law will give a straight line through origin, as shown in the current-voltage graph below.
This graph would be produced by a linear circuit. A linear circuit is one which produces a straight line graph and obeys Ohm’s Law.
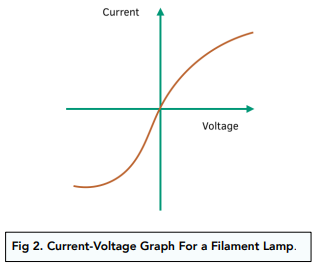
Filament Lamp
Below, we can see the current-voltage graph for a filament lamp. This type of lamp has a filament inside it. As the temperatures of the filament increases, the resistance of the filament lamp will also increase.
This graph would be produced by a non-linear circuit. A non linear circuit is one which does not produce a straight line current-voltage graph, but instead produces a curved line
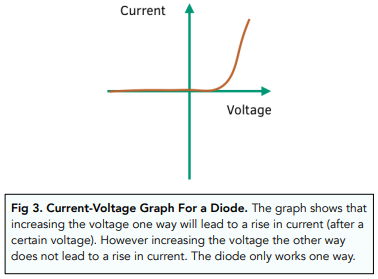
Diodes
Diodes are unique, since they only allow current to flow through them in one direction. The reason behind this is to do with resistance.
Within a diode, there are 2 pathways of resistance. One has very low resistance, whilst the other has very high resistance. Current always flows through the path with the least resistance.
Below, we can see the current-voltage graph for a diode. This graph would be produced by a non-linear circuit. Remember, non linear circuit is one which produces a curved line.

A current-voltage graph is a plot of the relationship between the electric current and voltage in a circuit. The graph is used to study the behavior of electrical circuits and devices, such as resistors, capacitors, and diodes.
Current-voltage graphs are important in physics because they provide a visual representation of how electric current and voltage are related in a circuit. This information is crucial for understanding the behavior of electrical circuits and devices, and for designing and testing new electrical components and systems.
The slope of a current-voltage graph represents the resistance of a circuit. A steeper slope indicates a higher resistance, while a shallower slope indicates a lower resistance. By analyzing the slope of a current-voltage graph, scientists and engineers can determine the resistance of a circuit and make changes to improve its performance.
Ohm’s Law states that the voltage across a resistor is proportional to the current flowing through it, and that the proportionality constant is the resistance of the resistor. This relationship is represented by the equation V = IR, where V is voltage, I is current, and R is resistance. This relationship is often plotted as a current-voltage graph, making it easy to see the relationship between current, voltage, and resistance.
A linear current-voltage graph is a graph that has a straight line relationship between current and voltage. This indicates that the resistance of the circuit is constant, regardless of the current flowing through it. Linear current-voltage graphs are often used to study the behavior of resistors and other components that have a constant resistance.
A non-linear current-voltage graph is a graph that has a curved relationship between current and voltage. This indicates that the resistance of the circuit is not constant, and changes with the current flowing through it. Non-linear current-voltage graphs are often used to study the behavior of components like diodes and transistors, which have a non-constant resistance.
Current-voltage graphs are used in a wide range of real-world applications, from designing and testing electrical components and systems, to characterizing the performance of solar panels and batteries. By analyzing current-voltage graphs, engineers and scientists can optimize the performance of electrical systems and develop new technologies to meet the ever-growing demand for energy and power.
Still got a question? Leave a comment
Leave a comment