


Ray Diagrams (GCSE Physics)
Ray Diagrams
Ray Diagrams
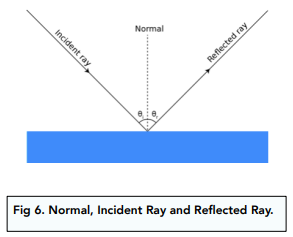
For exams, you should be able to draw out ray diagrams to show the reflections of waves at a surface. To do this, you will need a sharp pencil, a ruler and a protractor.
Method
- Draw on the ‘normal’. The ‘normal’ is simply another word for a line that is at 90 degrees to the boundary.
- Draw the incident ray. Using a protractor, measure out an angle. Using a ruler, draw a straight line along the angle to create the incident ray.
- Draw on the reflected ray. Again, take your protractor and measure out the same angle as before. This time, you should be measuring the angle on the opposite side. Draw a straight line along this angle, ensuring that it touches the normal.
Investigating Reflection of Light
Method
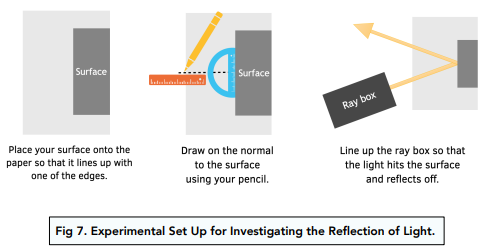
1. Gather the equipment. For this experiment, you will need a ray box, a piece of paper, a pencil, a surface and a protractor.
2. Set up the equipment. Place your surface onto the paper so that it lines up with one of the edges. Draw on the normal to the surface using your pencil. Place the ray box so that it can be aimed at the surface at different angles.
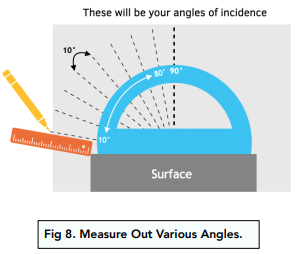
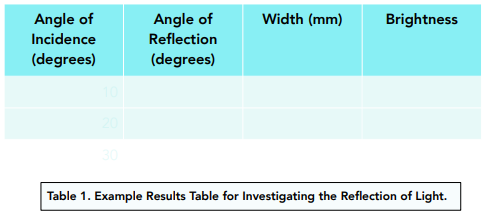
3. Measure out various angles. Using your protractor, measure out angles from the normal. The angles should increase by 10 degrees each time, up to a value of up to 80 degrees. Using your pencil, draw lines onto the paper at each angle. Measure the width of each ray and note down its brightness.
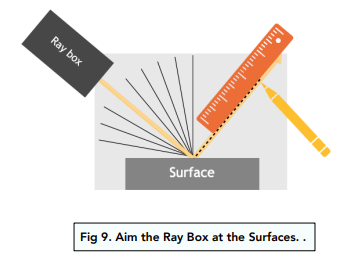
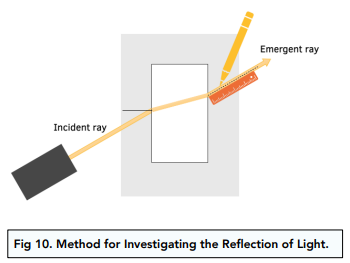
4. Aim the ray box at the surfaces. Following the various angles you have just drawn onto the piece of paper, aim the ray box at the surface. As the ray is aimed, you will see that a reflected ray will also appear. You should trace over this reflected ray using your pencil. Repeat for all the rays.
5. Record your results. You should note down all the angles of incidence, reflection width and brightness in a table such as the one below.
6. Find the refractive index. You can then calculate the refractive index of the block by plotting a graph of sin i (y-axis) against sin r (x-axis). The gradient of the graph will tell you the refractive index.
Investigating Refraction of Light
Method
- Gather the equipment. For this experiment, you will need a ray box, a piece of paper, a pencil, a transparent block of material and a protractor.
- Set up the equipment. Place the block in the centre of the piece of paper. Trace around the block. Position the ray box so that it can be aimed at the block.
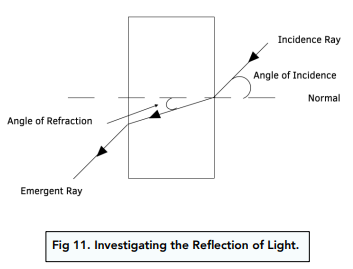
- Draw on the normal. Using a ruler and a protractor, draw on a line that is 90 degrees to the block. This will act as the normal.
- Draw the incident ray. Using the protractor, measure an angle from the normal. Draw a line along this angle and then aim the light ray along it. Trace this ray; it is the incident ray. Make sure to label this ray with the angle.
- Draw the emergent ray. When the ray box is aimed at the block, you will see the incident ray going into the block, and another ray coming out of the other side of the block. This is the emergent ray, which you should draw over using your pencil. Make sure to label this ray with the angle of the incident ray.
Still got a question? Leave a comment
Leave a comment