


Heating and Cooling Graphs (GCSE Physics)
Heating and Cooling Graphs
Heating and Cooling Graph
For Exams, you must be able to interpret heating and cooling graphs.
Heating Graph
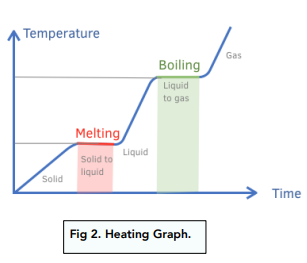
We are going to discuss the heating graph step by step:
- Solid Heating – as temperature and time increases, the solid is starting to heat up.
- Melting – once the solid reaches its melting point (in this case it is 0 degrees), it starts to melt and turn into a liquid.
- Liquid Heating – as temperature and time increases, the liquid is starting to heat up.
- Boiling – once the liquid reaches its boiling point (in this case, it is 100 degrees), it starts to evaporate and turn into a gas.
The straight lines on the graph are very important. These are points where the substance is being heated, but instead of increasing in temperature, the substance is changing state.
Cooling Graph
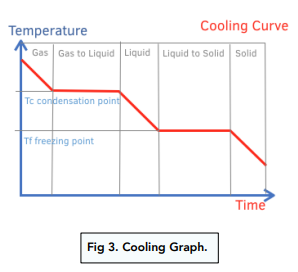
We are going to discuss the cooling graph step by step:
- Gas cooling – the gas is being cooled down as time goes on.
- Gas to liquid – once the gas reaches its condensation point, the gas condenses into a liquid.
- Liquid cooling – the liquid is being cooled down as time goes on.
- Liquid to solid – once the liquid reaches its freezing point, the liquid freezes into a solid.
Again, the straight lines on the graph are very important. These are points where the substance is being cooled, but instead of decreasing in temperature, the substance is changing state.

Heating and cooling graphs are graphs that show how temperature changes over time as a result of heating or cooling. These graphs can be used to understand how different materials respond to changes in temperature and to make predictions about future temperature changes.
The different parts of a heating or cooling graph include the x-axis, which represents time, and the y-axis, which represents temperature. The graph will also include a line or curve that shows how temperature changes over time as a result of heating or cooling.
Heating and cooling graphs can be used in many real-life applications, such as in the study of thermodynamics, in the design of heating and cooling systems, and in the prediction of future temperature changes in the atmosphere or in a building.
Heating and cooling graphs are different in terms of the direction of the temperature change they represent. A heating graph shows how temperature increases over time as a result of heating, while a cooling graph shows how temperature decreases over time as a result of cooling.
The key features of a heating or cooling graph include the initial temperature, the rate of temperature change, and the final temperature. These features can be used to make predictions about future temperature changes, as well as to understand the behavior of different materials in response to heating and cooling.
Students can use heating and cooling graphs to understand the concept of temperature change over time, as well as to make predictions about future temperature changes. By studying heating and cooling graphs, students can gain a deeper understanding of the principles of thermodynamics and be better prepared for questions related to this topic on their GCSE physics exams.
These questions and answers provide a comprehensive overview of heating and cooling graphs, making it easier for 15-16 year old students to understand the concept as they prepare for their GCSE physics exams.
Still got a question? Leave a comment
Leave a comment