


Organisation & Trophic Levels - Pyramids of Biomass (GCSE Biology)
Pyramids of Biomass
Biomass
Pyramids of Biomass
Biomass is tissue that is living or recently dead.
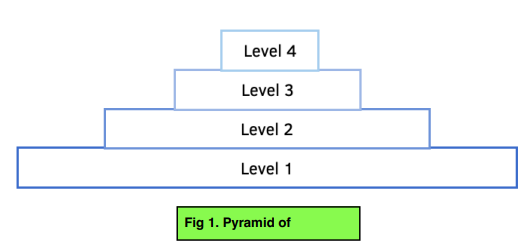
You can use pyramids of biomass to map out the trophic levels in a food chain. The biomass should decrease as you go up trophic levels. When you construct these graphs, there are a few rules:
- The producer is at the bottom of the pyramid, at trophic level 1.
- You must construct the pyramid to scale. Therefore, if the mass of a producer is 100kg, the second trophic level 70kg, the third trophic level 50kg and the final trophic level 10kg, the bars must have a length of 10, 7, 5 and 1 units respectively.
- The bars must be equally spaced from the midpoint.
- The bars must be touching.

Pyramids of Numbers
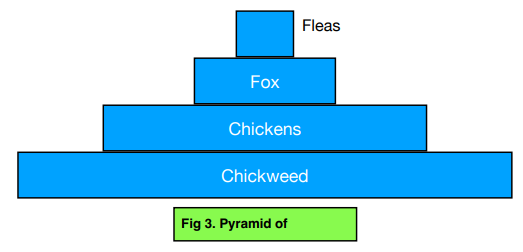
Pyramids of numbers show the number of organisms at each stage of the food chain instead of showing the energy transferred. For example, 2,000 chickweeds would be followed by 40 chickens which would be followed by 1 fox which would be followed by 400 flees. When using pyramids of numbers, the number of organisms might increase at the next trophic level e.g. 1 fox to 400 fleas. So when drawing it out, the bar for the fleas would be longer than the bar for the fox. However, in reality, the amount of energy transferred decreases.
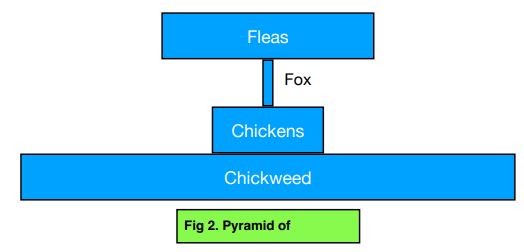
Using a pyramid of biomass would be better to represent the transfer of energy. Even though there are more fleas than foxes, their biomass in total is still significantly lower and energy is lost at each trophic level. Hence, the transfer of biomass can be represented in a nice pyramid.
Still got a question? Leave a comment
Leave a comment