


Forces - 5.6.1.4 The Distance - Time Relationship (GCSE Physics AQA)
The Distance – Time Relationship
Forces Acting On Objects
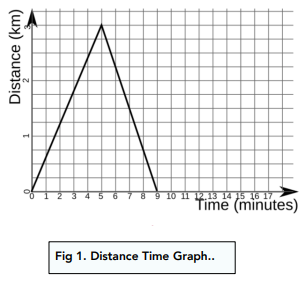
- Distance-time graphs can represent motion. On a distance-time graph, we can represent the motion of an object. The y-axis represents the distance travelled by the object. The x-axis represents the time taken for the object to travel this distance.
- Distance-time graphs show objects travelling in a straight line. Objects that are represented on a distance-time graph will move along a straight line. Along this line, the object can speed up, slow down or change direction.
Calculating Speed from a Distance-Time Graph
Calculating Speed from a Straight Line Graph
The equation for speed is:
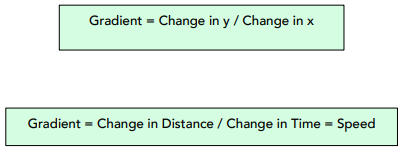
The equation for gradient of a distance-time graph is:
Therefore, by finding the gradient of a distance-time graph, we can find the speed of the object. We will explore this in the following example.
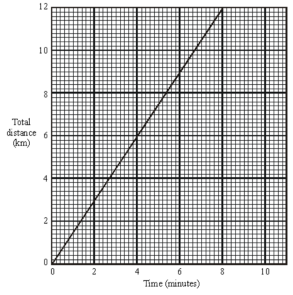
Question: Below is a distance-time graph for part of a train journey. The train is travelling at a constant speed.
Calculate the speed of the train, with units.
Speed is the gradient. Since this is a distance-time graph, the gradient will tell us the speed of the train.
1. Use the formula for gradient.
To find the gradient of a graph, we use the formula change in y / change in x.
gradient = change in y / change in x = distance / time
2. Find the distance and time.
Using the graph, find values for distance and time.
Distance = 12km
Time = 8 mins
3. Use the equation.
Now that we have values for distance and time, we can use our formula from step 2.
Distance / time = 12 / 8
12 / 8 = 3 / 2
Speed = 1.5 km/min
Calculating Speed from a Curved Graph
If a distance-time graph is curved, then the object is changing speed because the gradient is changing. Therefore it can be accelerating (curving up) or decelerating (curving down).
This makes it difficult to work out the speed a certain point. Through the following example, we will see how to do this:
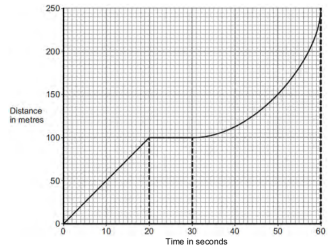
Question: A bus is taking some children to school. The bus has to stop afew times. The figure below shows the distance–time graph for part of the journey.
What is the speed of the bus at 45 seconds? Show clearly on the figure above how you obtained your answer.
Speed is the gradient. Since this is a distance-time graph, the gradient of the graph is still the speed.
1. Find the gradient at 45 seconds.
We are asked to find the speed of the bus at 45 seconds, so we need to find the gradient of the graph at 45 seconds.
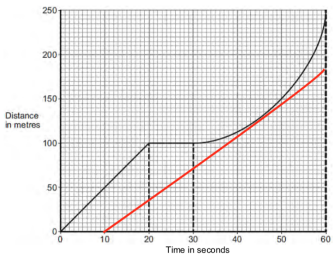
2. Draw a tangent at 45 seconds.
At the time 45 seconds on the x axis, find the corresponding y axis value. At this point, draw a tangent to the curve.
3. Find the distance and time.
Using the graph, find values for distance and time from the tangent.
Distance = 185 metres
Time = 60 – 10
Time = 50 seconds
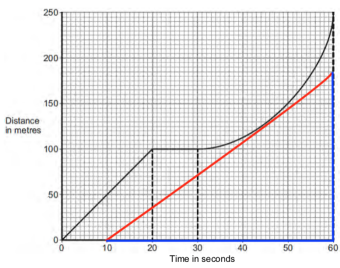
4. Use the gradient equation.
Now that we have values for distance and time, we can use our formula change in y / change in x to find the speed at 45 s.
gradient = change in y / change in x
Gradient = speed
speed = distance / time
Distance / time = 185 / 50
speed = 3.7 m/s
5. Use the gradient equation.
Now that we have values for distance and time, we can use our formula change in y / change in x to find the speed at 45 s.
gradient = change in y / change in x
Gradient = speed
speed = distance / time
Distance / time = 185 / 50
speed = 3.7 m/s
Still got a question? Leave a comment
Leave a comment