


Break-Even Analysis
Vocabulary
Amortisation – is a cost associated with the falling in value of certain types of asset.
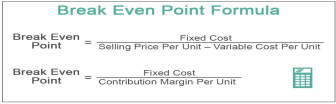
Break-even is the point at which total revenue and total costs are the same, meaning the business is making neither a profit nor a loss. The break-even level of output informs a business of how many products it needs to sell to reach the break-even point (BEP).
Question
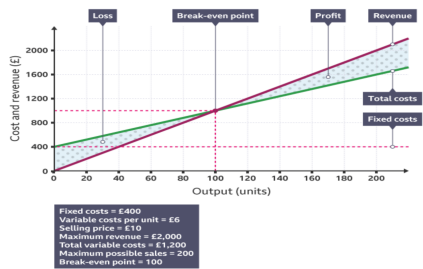
A business that sells T-shirts wants to find out what its BEP is.
Its fixed costs are £400.
The selling price (per unit) is £10.
The variable costs (per unit) are £6.
Margin of safety
The margin of safety is the amount sales can fall before the break-even point (BEP) is reached and the business makes no profit. This calculation also tells a business how many sales it has made over its BEP.
The margin of safety is calculated as follows:
Margin of safety = actual sales − break-even sales
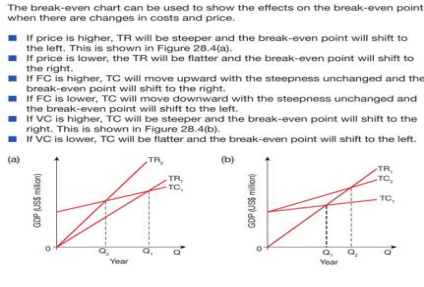
The break-even chart can be used to show the effects on the break-even point when there are changes in costs and price.
- If price is higher, TR (total revenue) will be steeper and the break-even point will shift to the left. (shown in (a) below).
- If price is lower, the TR will be flatter and the break-even point will shift to the right.
- If FC (fixed costs) is higher, TC (total costs) will move upward with the steepness unchanged and the break-even point will shift to the right.
- If FC is lower, TC will move downward with the steepness unchanged and the break-even point will shift to the left.
- If VC (variable costs) is higher, TC will be steeper and the break-even point will shift to the right. (Shown is (b) below).
- If VC is lower, TC will be flatter and the break-even point will shift to the left.
The limitations of using break-even to make business decisions
Break-even often uses forecasted figures and assumes that the business can sell the units that it produces. This means that it does need to be used with care, as there are a number of things that might affect the forecasted break-even point. These include:
- Marketing activities – any marketing activities that involve price reductions will affect the total revenue received. If successful, such a marketing campaign may lead to an increase in sales that is sufficient to increase total revenue. This would lower the break-even point. However, if prices are reduced and sales fail to increase sufficiently, then total revenue may fall, resulting in a higher break-even point.
- Changes in costs – the costs used to calculate the break-even point may not be accurate if they are based on forecasts. Even if they are accurate, there may be unexpected changes in costs, such as the price of raw materials increasing. Any increase in costs will lead to an increase in the break-even points.
- Changes in external factors – a change in things beyond the control of a business can also affect the usefulness of break-even. For example, if a new competitor launches a better product, the sales and revenue might be lower than forecasted.
In addition, whilst break-even is good for businesses that produce products that it sells for the same price, it is less useful for businesses that provide services. This is because customers may pay different prices based upon the service they request. For example, a hairdresser will charge more for colouring and cutting somebody’s hair than they would for just cutting it. This makes it more difficult to predict revenues accurately.
Still got a question? Leave a comment
Leave a comment