


11.2 The Development Gap
What is the Development Gap?
Development is using natural and human resources to achieve a higher standard of living; therefore, as a quantity, it describes a country’s economic growth and wealth. However, you can develop socially to improve your quality of life. As a result, a country’s level and speed of development can be affected by several things which include environmental, economic, social and political factors.
The Development Gap describes the vast differences in levels of development worldwide.
How do we measure the Development Gap?
Development Indicators
Development indicators are measures of development that involve numerical values to illustrate and describe a country’s level of development. These indicators can either measure the standard of living (an economic measure of the wealth of a country) or quality of life (this is more difficult to measure and is a social measure of the economic, social, physical, political, spiritual and emotional wellbeing of inhabitants of a country).
| Standard of Living | GNP/I | Gross National Product/Income is the total value of goods and services produced by a country (including abroad).↑ = MEDC / ↓ = LEDC |
| GDP (per capita) | Gross Domestic Product is the total value of goods and services produced within a country (excluding abroad). Per Capita means per person and is used to illustrate the average wage.↑ = MEDC / ↓ = LEDC | |
| PPP | Purchasing Power Parity is GNP / GDP adjusted to the value of the currency within the country.↑ = MEDC / ↓ = LEDC | |
| Energy Consumption | This is the amount of energy used within a country per year.↑ = MEDC / ↓ = LEDC | |
| Broadband Users | This is the number of homes connected to broadband internet within a country.↑ = MEDC / ↓ = LEDC |
| Adult Literacy Rate | This is the percentage of adults who can read and write.↑ = MEDC / ↓ = LEDC | |
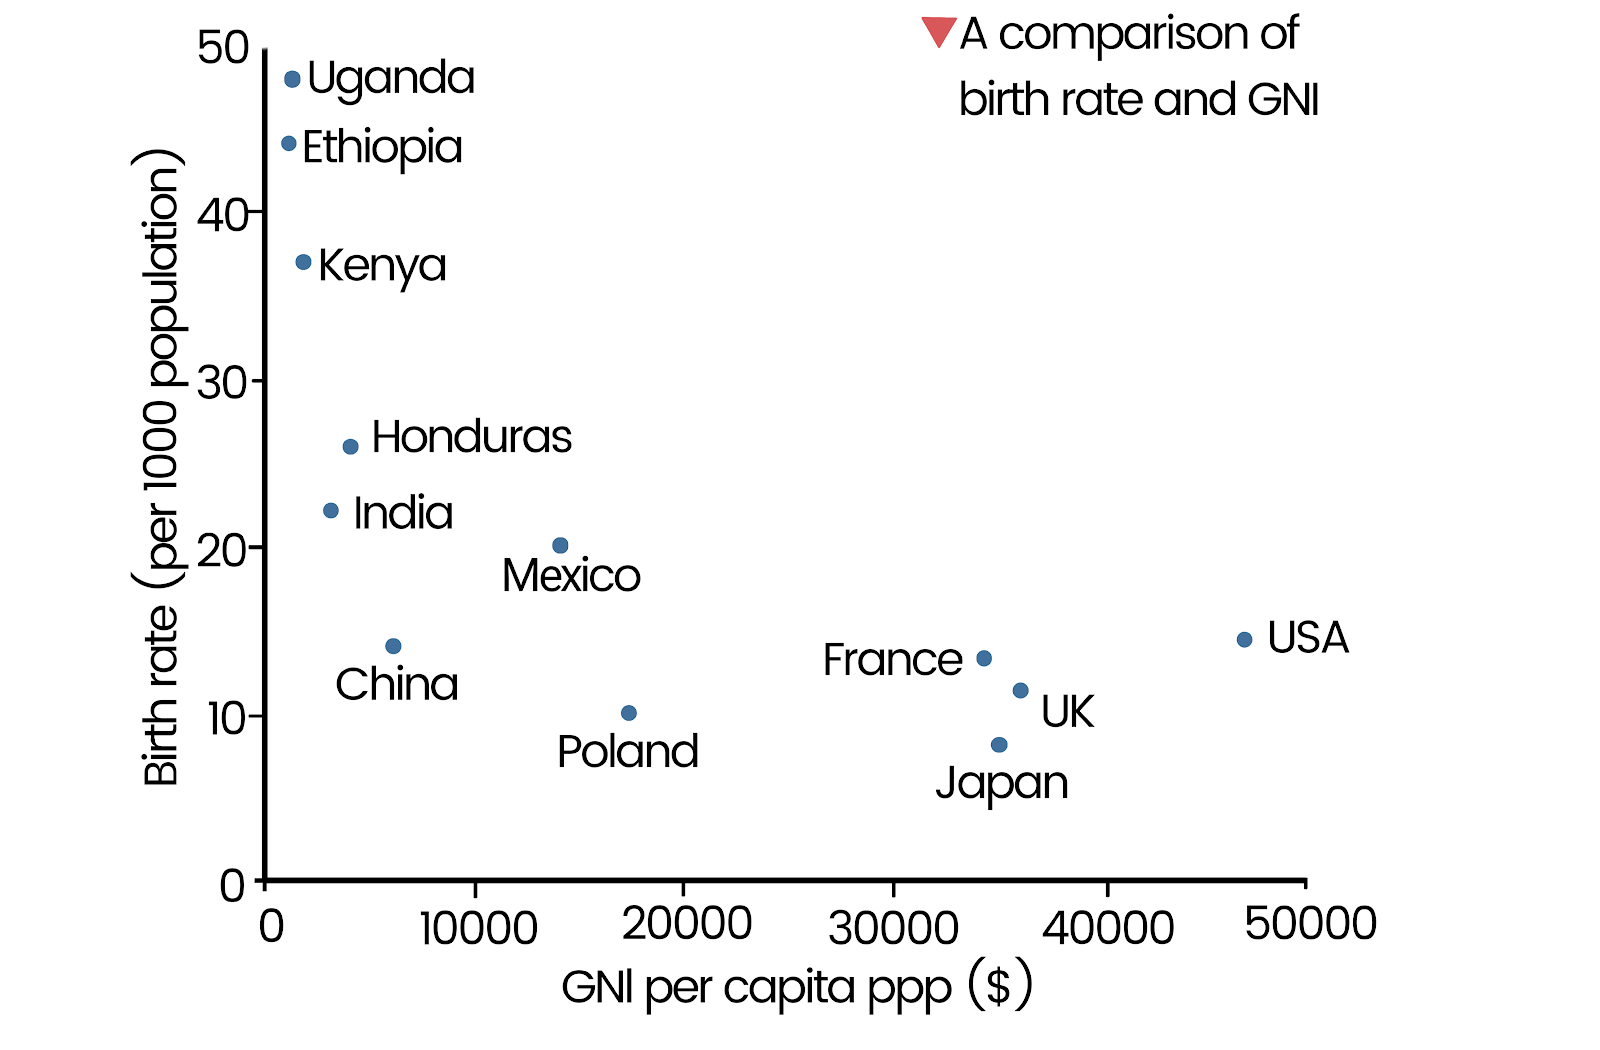
| Quality of Life | Birth Rate | This is the number of babies born per 1000 of the population per year.↑ = LEDC / ↓ = MEDC |
| Death Rate | This is the number of people who die per 1000 of the population per year.↑ = LEDC / ↓ = MEDC | |
| Infant Mortality | This is the number of children who die before their first birthday per year.↑ = LEDC / ↓ = MEDC | |
| Population Under 15 | This is the proportion of the population under 15 years of age.↑ = LEDC / ↓ = MEDC | |
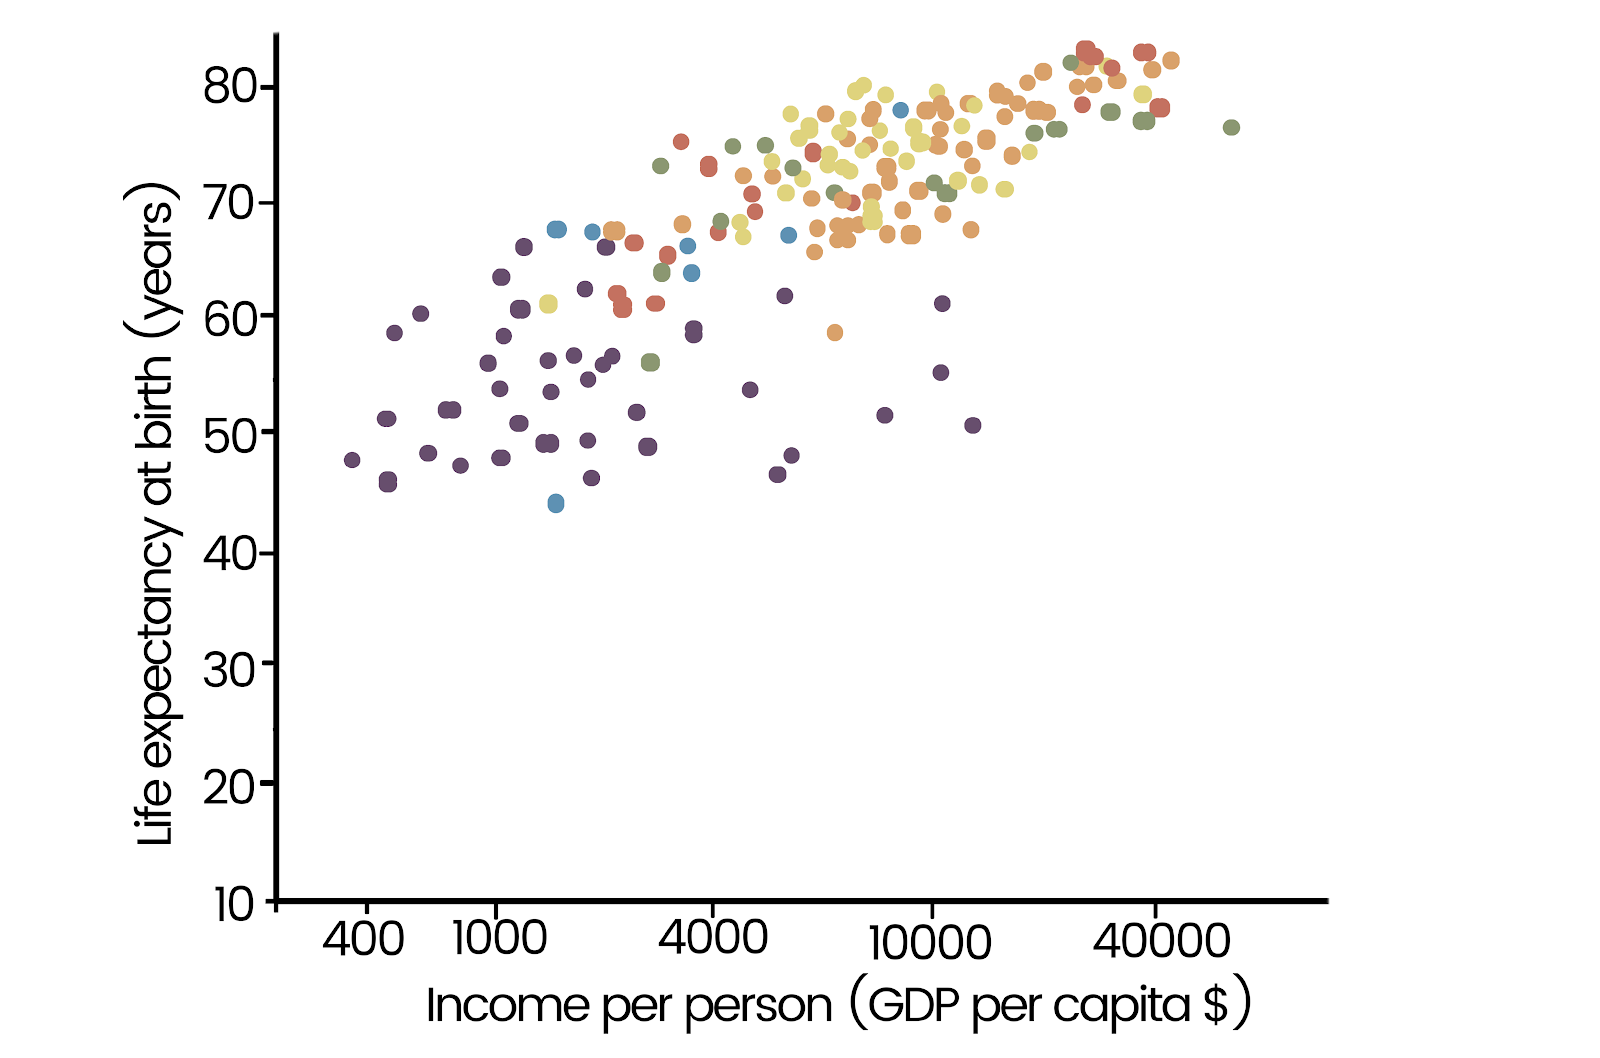
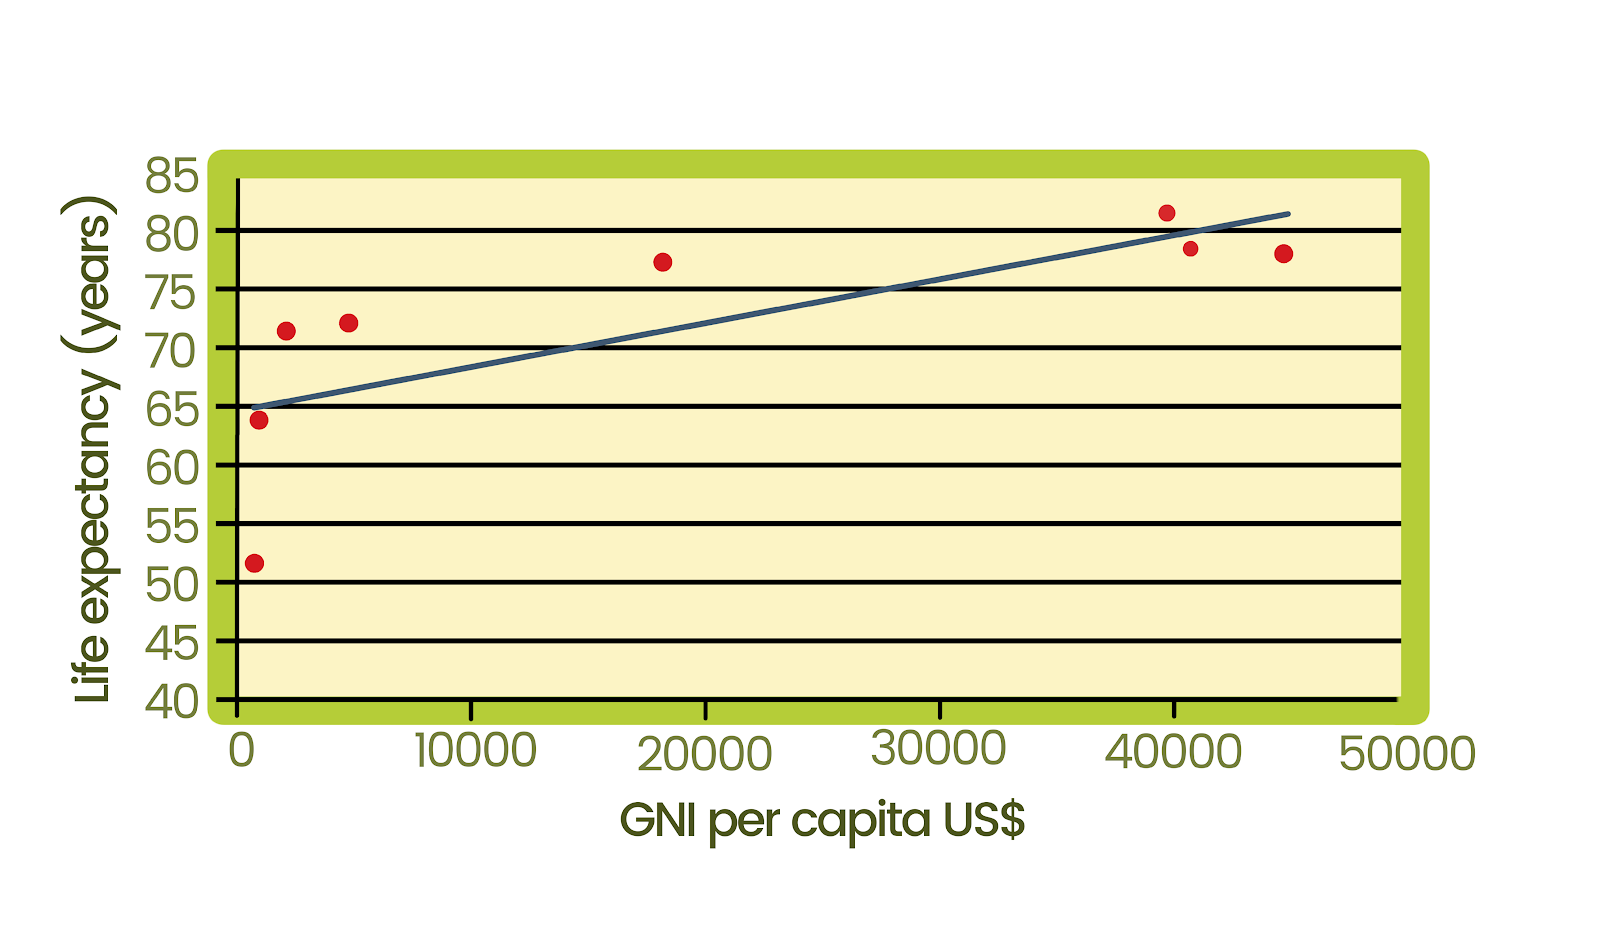
| Life Expectancy | This is the average number of years a person can expect to live in a country.↑ = MEDC / ↓ = LEDC | |
| Average Calorie Intake | This is the average number of calories and thus food each person consumes in a country on average per day.↑ = MEDC / ↓ = LEDC | |
| People per Doctor | This is a ratio of the average number of patients per doctor in a country.↑ = LEDC / ↓ = MEDC | |
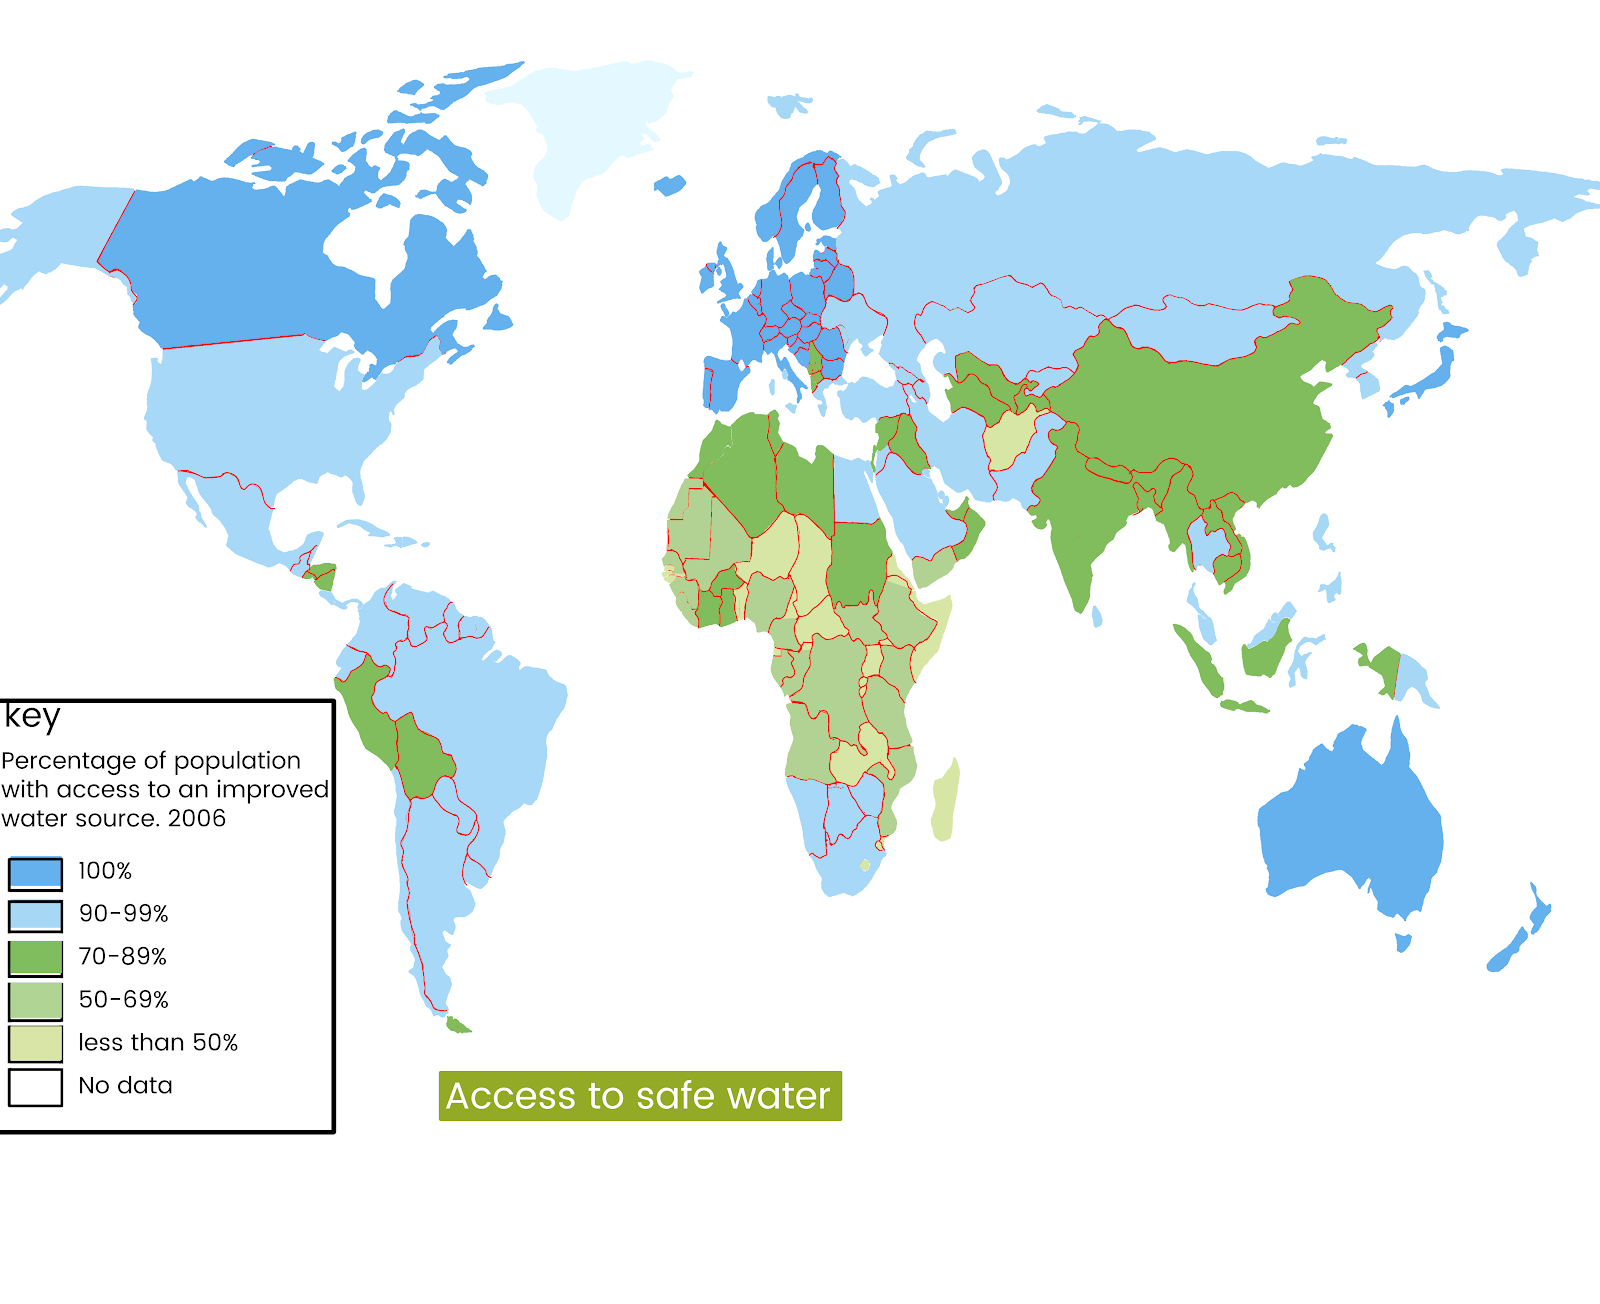
| Access to Safe Water | This is the percentage of people in a country who have regular access to sufficient quality and quantity of water.↑ = MEDC / ↓ = LEDC | |
| HIV / AIDS Incidence | This is the percentage of the population who suffer from HIV and AIDs↑ = LEDC / ↓ = MEDC |
These graphs show examples of correlations between different development indicators which you need to be able to describe and explain in detail:
There are several issues with using a single development indicator. For example, GDP/capita averages the wealth of a few over many and doesn’t consider the fact that you can live a very comfortable and happy subsistence lifestyle. Also, all single development indicators only consider either quality of life or standard of living, not both (although they are related to a certain extent).
Another problem is that it’s easier to collect economic data for MEDCs as LEDCs tend to have a large incidence of informal employment and subsistence living. Furthermore, the death rate is a bad measure of development due to the ageing population in MEDCs causing an increase through old age as opposed to disease or poor health care. However, there are some good measures of development; for instance, birth rate can indicate whether children are economic assets or burdens, health care (and contraception), infant mortality and infrastructure.
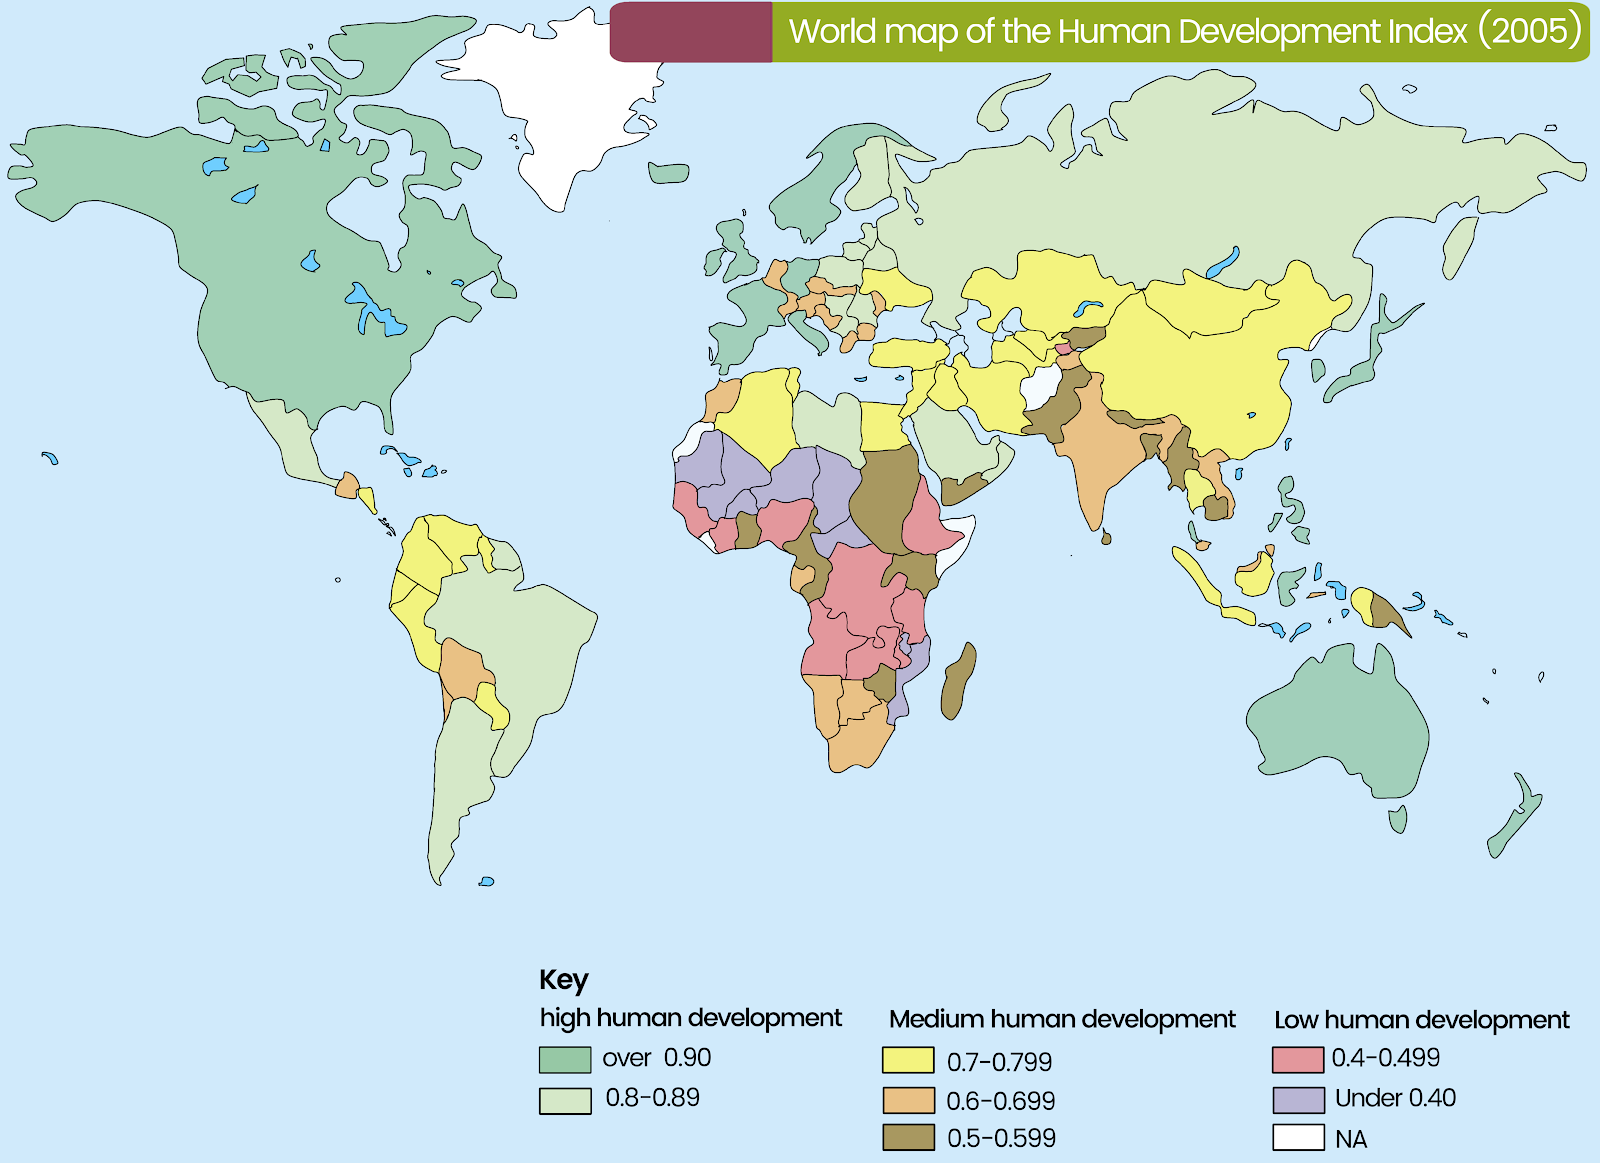
The UN alternative is the Human Development Index (HDI). This is more reliable because it shows how people are benefitting from a country’s economic growth by ranking countries by both standard of living and quality of life by taking into account life expectancy, educational attainment (literacy rate and years spent at school) and GNP/capita (adjusted for PPP). The country is ranked for each of the three areas, and then the average of these ranks gives their final score (high = ≥ 0.800 / medium = 0.500 – 0.799 / low = ≤ 0.499).
Dividing the World
Historically, there have been several different methods; the first two are more outdated whilst the final three are more modern and relevant:
- The Three Worlds:
- First World = Capitalist Countries (USA & its Allies)
- Second World = Communist Countries
- Third World = Other Countries (e.g. HIPCs)
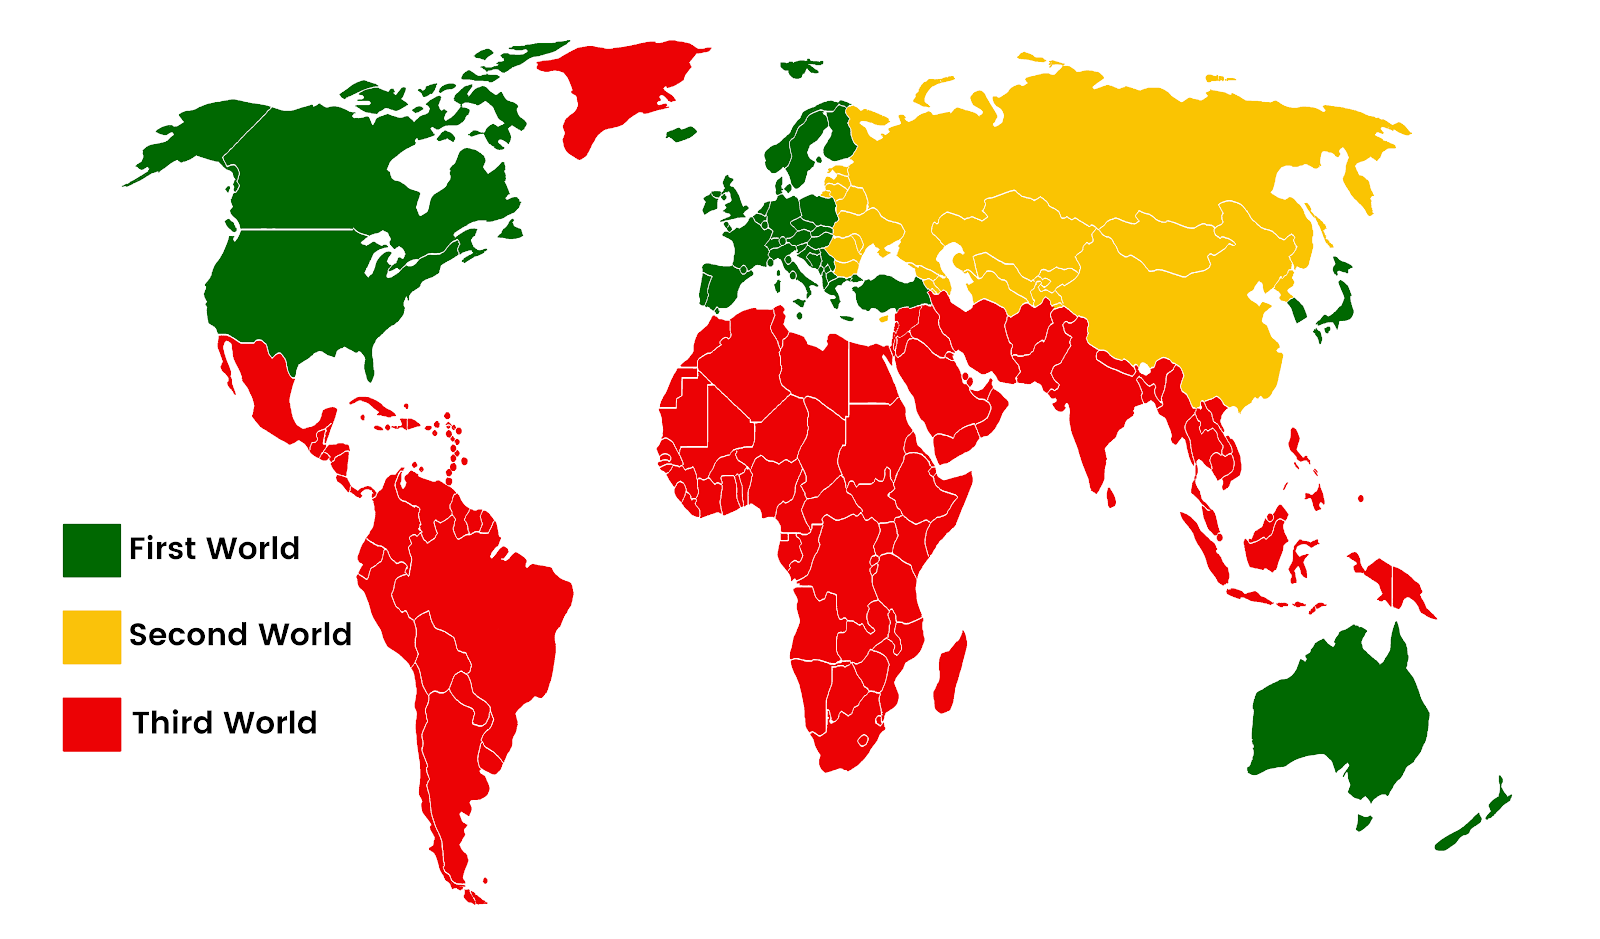
The problem with this is that it suggested that poorer people were lower class citizens and less valued due to being in third place.
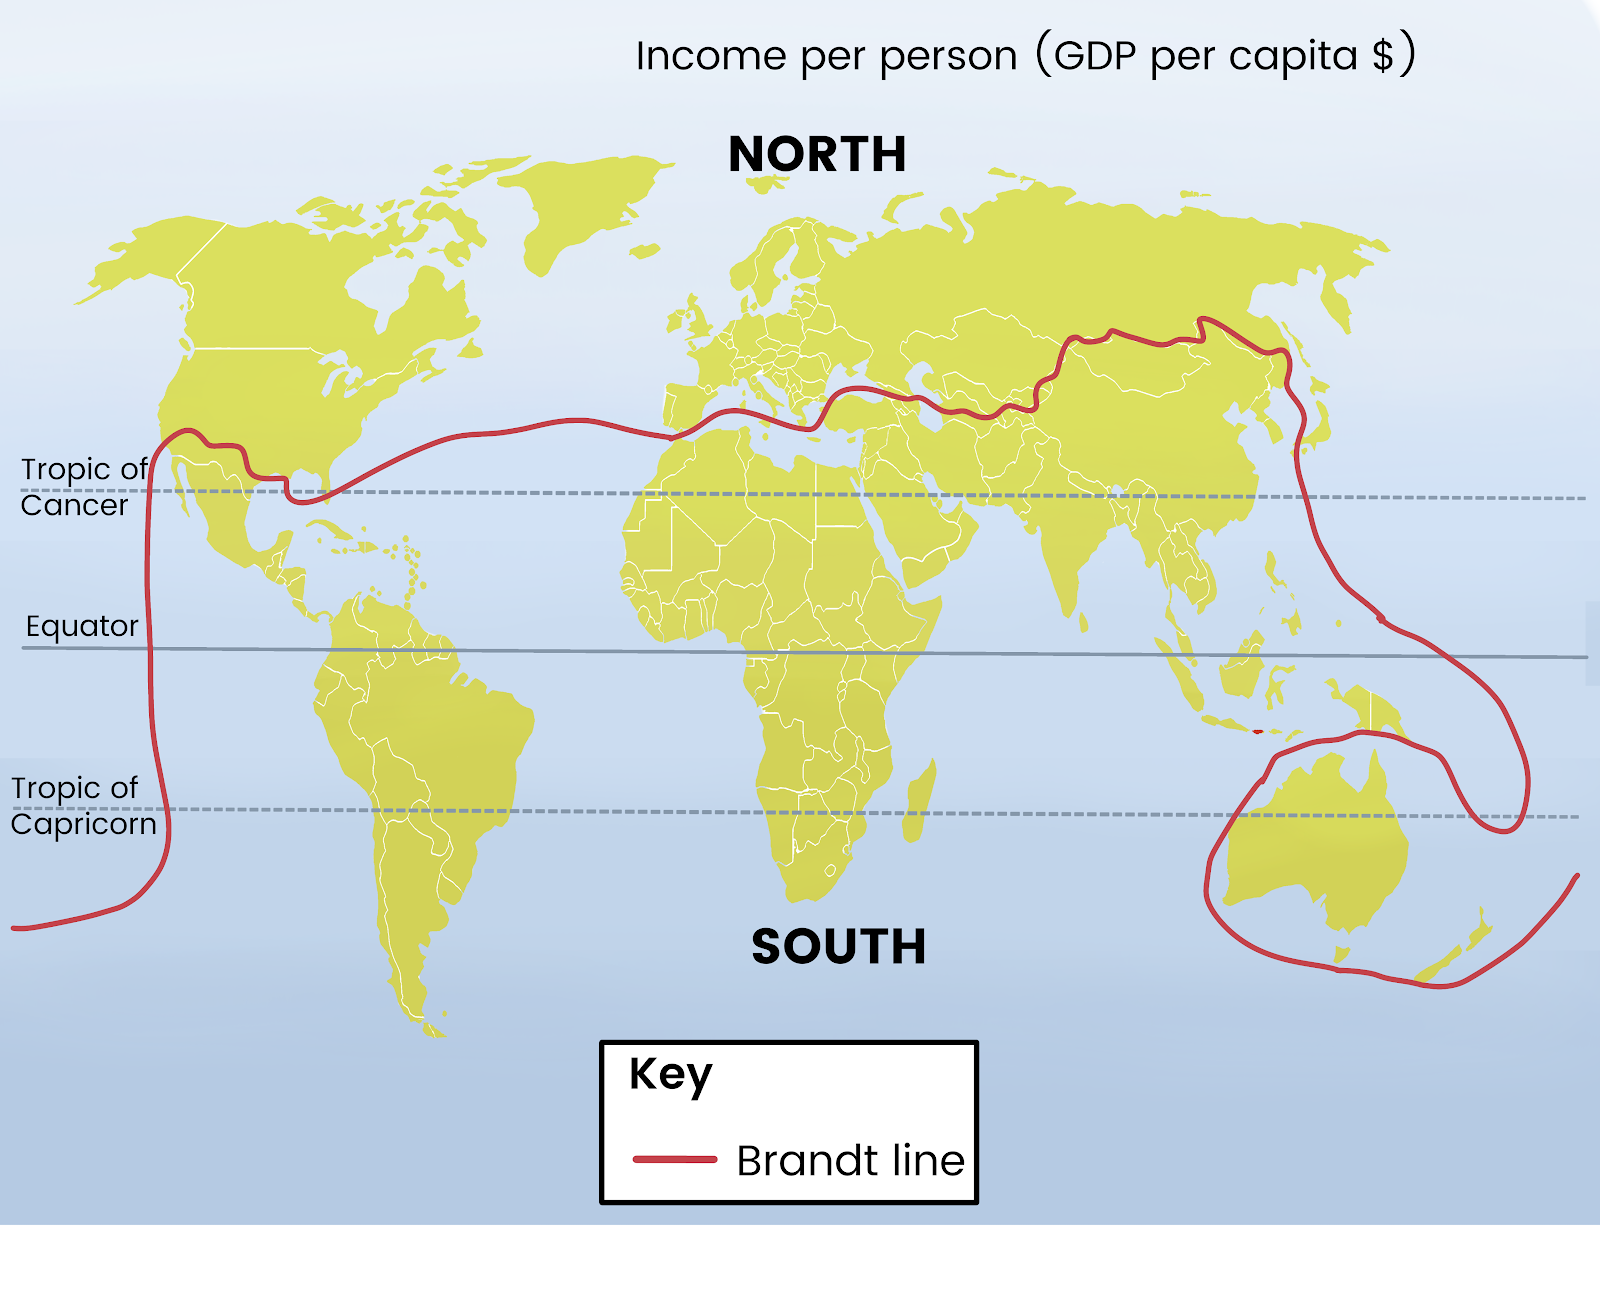
- The North-South Divide:
The Brandt Report was published in 1971 regarding the state of world development. GNP divided the world into rich/industrialised countries in the North (MEDCs) and the poorer, mainly agricultural economies in the South (LEDCs). A line known as the Brandt Line was drawn on the world map to illustrate this division, but it is now criticised for being more simplistic as there are too many different types of countries for a simple half-and-half (MEDC, NIC, RIC, LEDC, LLEDC and more!).
- UN – HDI:
This is a social division of the world using the data gathered by the UN.
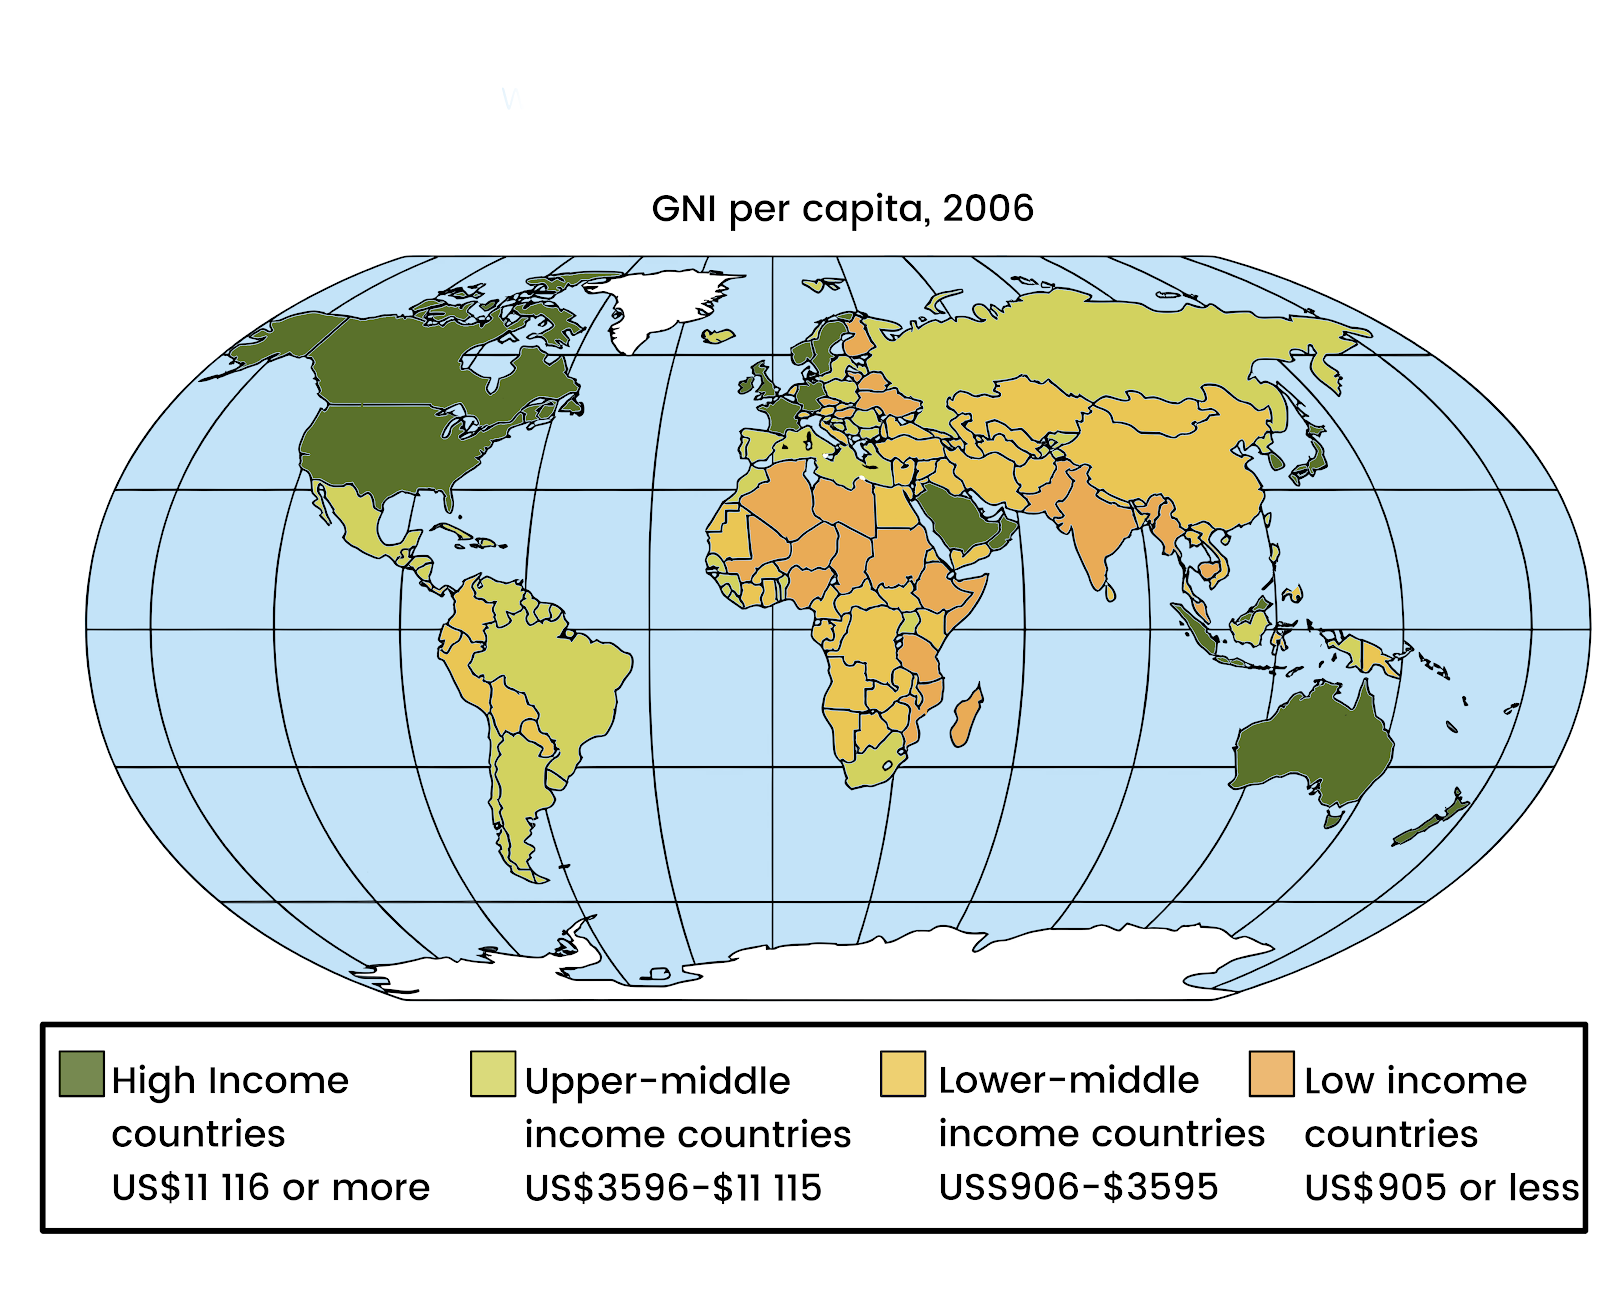
- World Bank – Four Main Income Groups:
This is an economic division of the world as classified by the World Bank.
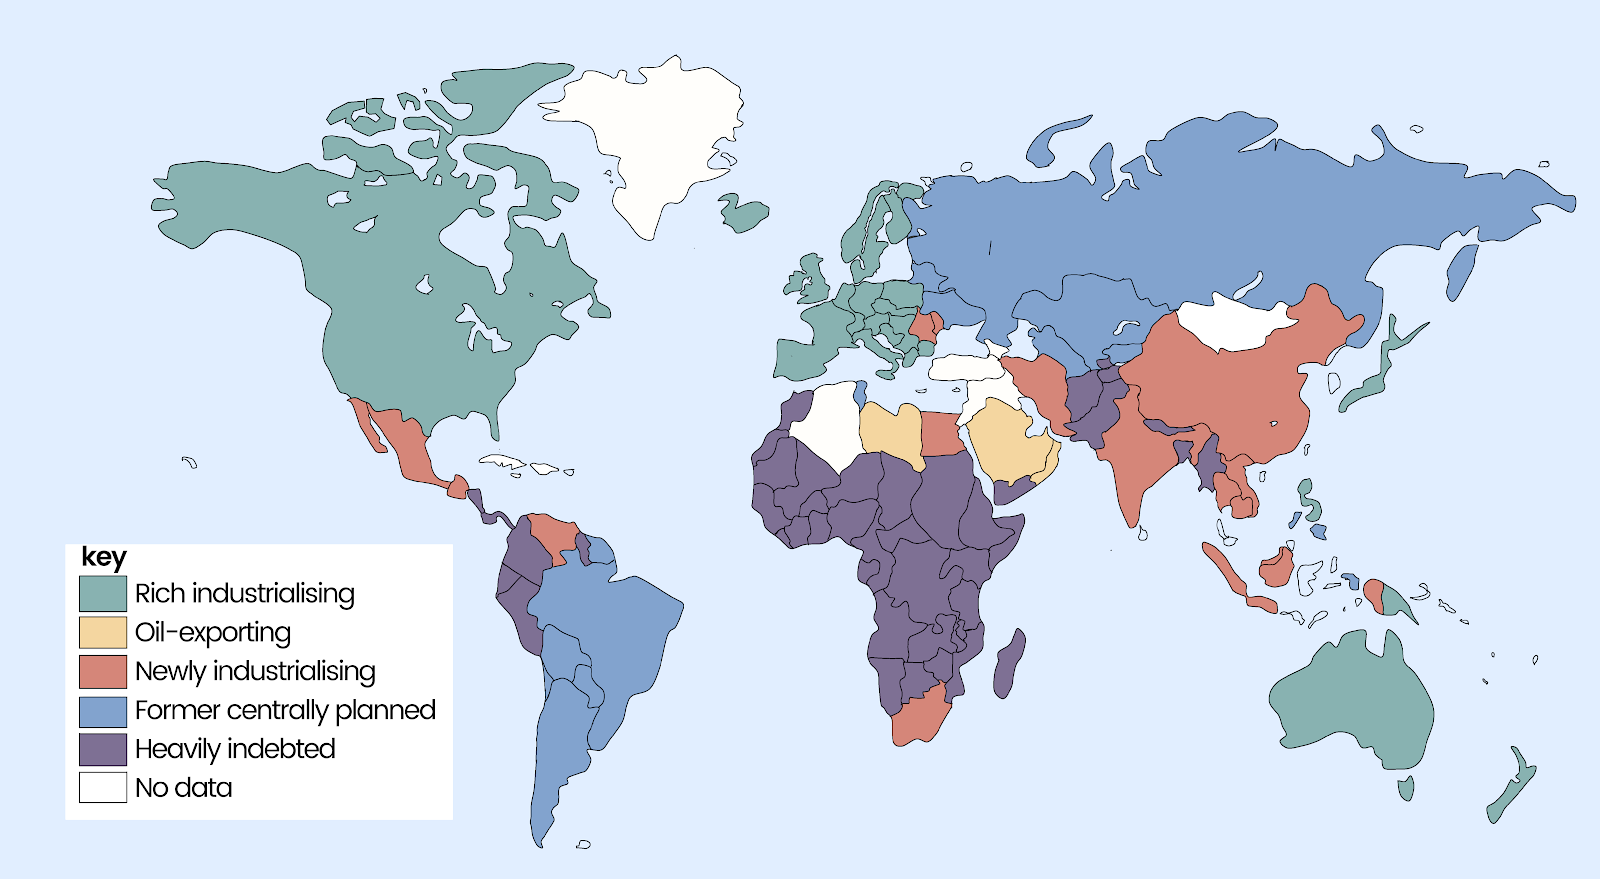
- The Five Fold Division:
This is an economic division of the world based upon wealth and how this relates to a country’s history.
What are the causes of the Development Gap?
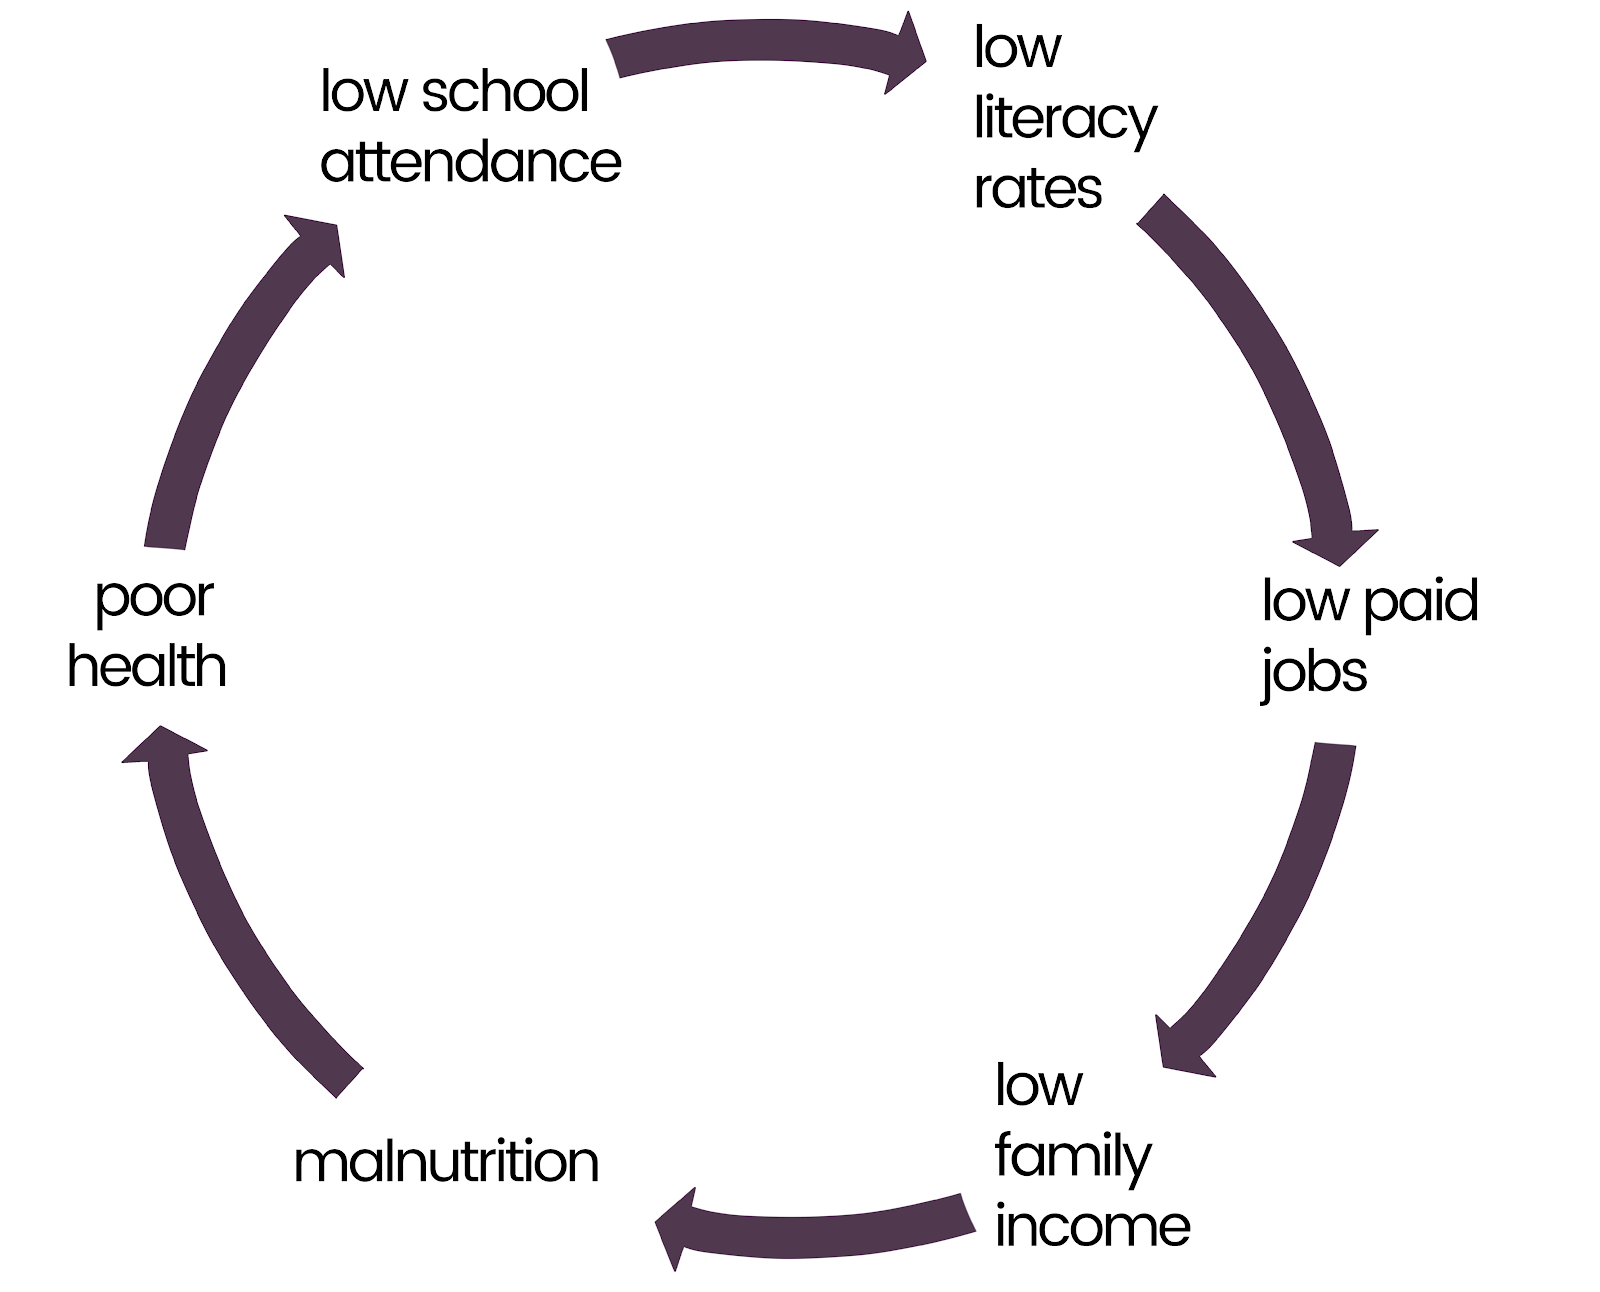
The Poverty Cycle
Political Factors
- Wars and conflict can negatively affect development due to causing death and injury, internal displacement and refugees, infrastructure damage, over-dependence on foreign aid and international sanctions.
- Mismanagement and corruption can negatively affect development due to lack of investment, human rights, welfare, health problems, wrong decisions causing food shortages, and the rich politicians taking all the resources for themselves.
- Communism can negatively affect development due to lack of investment and motivation to work hard (the idea that no matter how much or little work you do, you still get the same reward – hence people do the bare minimum).
- Colonialism can negatively affect development due to causing historic lack of investment and then future independence causing mismanagement through lack of knowledge and experience.
Case Study: The Democratic Republic of Congo (DRC), Africa
- Population of 70m.
- Former colony of Belgium (until 1960s).
- Rich in natural resources, including gold, diamond, and zinc, 70% world’s COLTAN (used to make computers and mobiles), rainforests and 13% of the world’s potential HEP through River Congo.
- Second largest country in Africa but almost landlocked.
- Only 9% of the population has access to electricity.
- Adult literacy rate = 67%.
- Life expectancy = 48.
- Last place in HDI rankings (187th – 2011 data).
- Average annual income = $300 ≈ £150.
- Civil War:
- Neighbouring Rwanda has 3 main ethnic groups (incl. Hutus & Tutsis).
- 1990s – Rwanda was run by Hutus but at war with rebel Tutsis.
- 1994 – Tutsis started winning battles so Hutus committed genocide of Tutsis (75%, 1/2 m killed in 13 weeks!).
- 1997 – the Hutu government was overthrown so Hutus fled to Zaire (now DRC) and linked up with the Congolese government which started attacking Tutsis in Zaire. Tutsis started a new war to fight both the Hutus and Congolese governments and were successful = in renaming the country DRC and the new president (Kabila).
- President Kabila didn’t force Hutus to leave the DRC, so Rwanda sent another rebel force. Kabila asked for protection from Zimbabwe, Namibia and Angola, whilst Rwanda gained support from Uganda. This international war lasted 1997 – 2003.
- War resulted in countries’ looting the DRC of its resources and riches in addition to the death of over 5 million people from starvation and famine (45,000 per month). Also, there has been a lack of governmental/foreign industry investment, internally displaced people (IDPs) / refugees, less tourism and infrastructure damage.
Case Study: Zimbabwe, Africa
- Population of 12m with an average age of just 18.3 years.
- 82% have access to safe water.
- Life expectancy = 49 – 2011 data (61 in 1990).
- HDI = 0.376, 173rd rank – 2011 data (0.654 in 1990).
- Infant mortality rate = 68 – 2005/6 data (52 in 1990).
- GNI/capita PPP = $176.20 – 2008 estimate.
- Granted independence from Britain in 1980.
- Robert Mugabe:
- Black African who became president in 1987.
- Leader of ZANU-PF party – against white minority rule.
- ‘Redistributed’ land from white farmers to black Zimbabweans who lacked the agricultural skill to ‘benefit’ those who were landless during the 1990s / early 2000s. This led to a sharp fall in food and fuel production and, thus, a collapse of the agricultural-reliant economy and rapid inflation. A state of disaster was declared in 2002 and now relies on aid agency grain handouts.
- Most skilled workers emigrated.
- Suspended from Commonwealth in 2002 before exit (international ostracism).
- The 2005 ‘clean up’ programme demolished urban slums home to many opposition supporters = homelessness.
- The 2008 election resulted in threats and violence and a re-run due to losing the first election. Now a power-sharing deal = economy/relations improvements.
| Case Study: Sudan, AfricaSudan is located in North East Africa. In 2011 was 169th in the HDI out of 187 (before the split with South Sudan) (Score=0.408) Population of 45 million (incl. S. Sudan = 8 million). Life expectancy of just 55 years. Only 57% have access to safe water. Drought has led to the desertification of farmland. | |
| Darfur Conflict (2003 – 2010?)Peace Agreements – 2006 & 2011.Black African & Arab Tensions (racial).300,000 dead – mostly from disease.3 IDPs – most live in camps.Ethnic Cleansing – 90% of targeted groups were destroyed.President Omar al-Bashir sent in troops, which cost lots of money and escalated the conflict.Many villages have been destroyed.Many are dependent on aid | North Vs. South (Civil War: 1955 – 1972 & 1983 – 2005)African South against Arab North.Guerrilla warfare.1.5m dead in two wars.4 million displaced people.Southern infrastructure was destroyed.South Sudan became independent in 2011, which led to an influx of previously displaced people returning.South Sudan relies on oil, with 75% of the former ‘united’ Sudan’s oil reserves. |
Social Factors
Water Quantity and Water Quality can negatively affect a country’s development by causing dehydration, increased infant mortality, decreased life expectancy, hygiene issues, disease and long journeys to collect it (prevents children from going to / concentrating at school).
- 12% of the world’s population uses 85% of the water.
- Daily Usage per Person = 47l in Africa, 334l in UK & 578l in USA.
- Cost Per 1000l = £1.22 UK & £360 Kibera (Nairobi, Africa).
- In many LEDCS, people travel 6km with 20kg of water on average.
- The UN estimates that 1/3 of the world’s population lives in a country under water stress.
Many people in LEDCs lack sufficient water quality, and this can lead to disease (a child dies from a water-related disease every 15s whilst in Ethiopia, nearly 74,000 children die from diarrhoea every year).
- Water-borne diseases (e.g. Cholera, Diarrhoea, Typhoid, and Dysentery) are spread by drinking or by washing food in contaminated water.
- Water-related diseases (e.g. Malaria) are spread by insects that breed in water.
- Water-based diseases (e.g. Bilharzia, Guinea Worm) are spread by vectors carrying the disease which live in water.
Case Study: Guinea Worm in South Sudan, Africa
- Worst rate of Guinea Worm infection worldwide, with 1/3 of the world’s cases.
- Sufferer soaks blister in water for pain relief.
- Blister bursts releasing larvae into water.
- Someone drinks the water containing the larvae.
- The larvae resist digestion and exit the digestive system through the small intestinal wall.
- Larvae grow into worms (up to 3 feet long) and mate before moving around the body, usually to the lower limbs.
- Blister forms and the sufferer becomes malnourished (worm eats food).
- The cycle repeats.
- Only treatable by slowly and carefully extracting worms (no cure or vaccine).
- Prevent by keeping infected people away from water sources and using filters.
- Eradicated in most countries.
Economic Factors
Trade can negatively affect development by limiting the GNP of LEDCs and boosting the GNP of MEDCs.
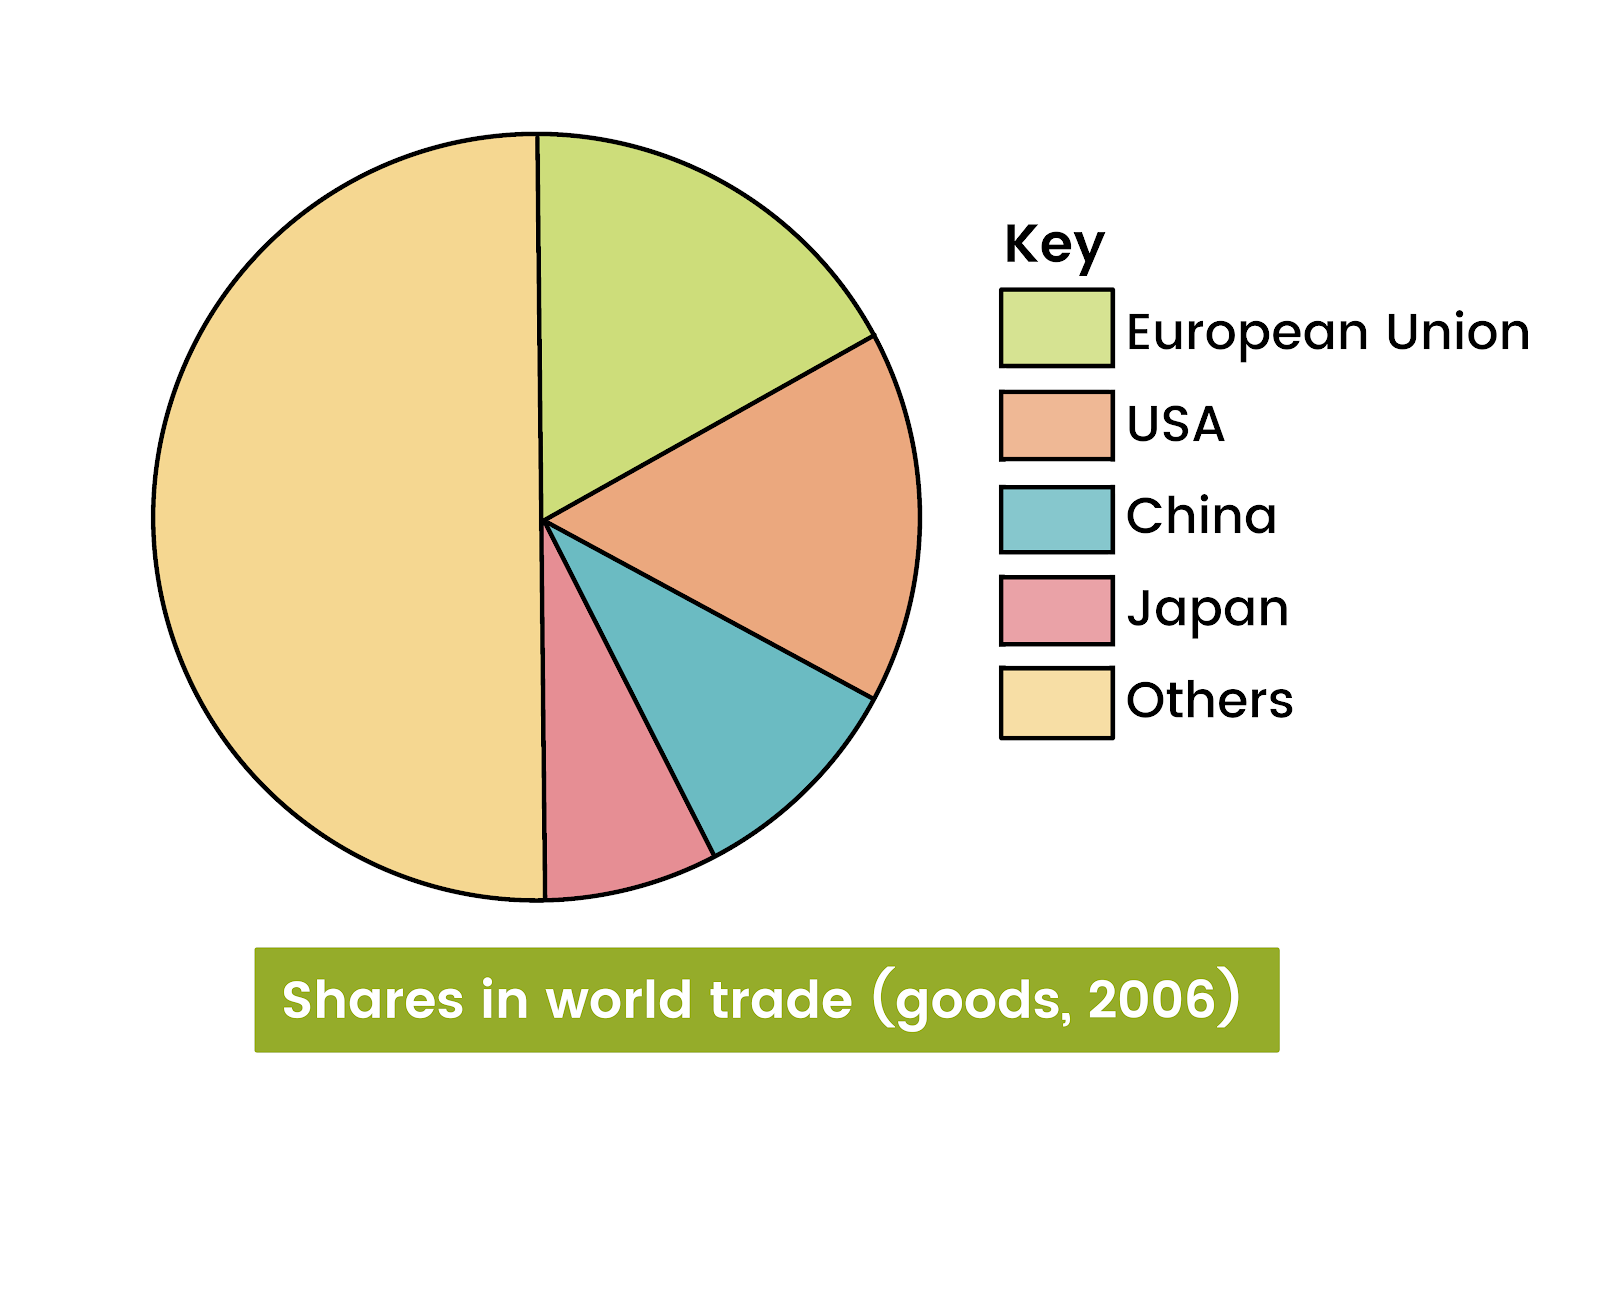
- World Trade is imbalanced; therefore MEDCs take advantage of LEDCs by importing primary products from LEDCs cheaply and then exporting manufactured goods to LEDCs at expensive prices. As a result, MEDCs are in a trade surplus, but LEDCs are in a trade deficit.
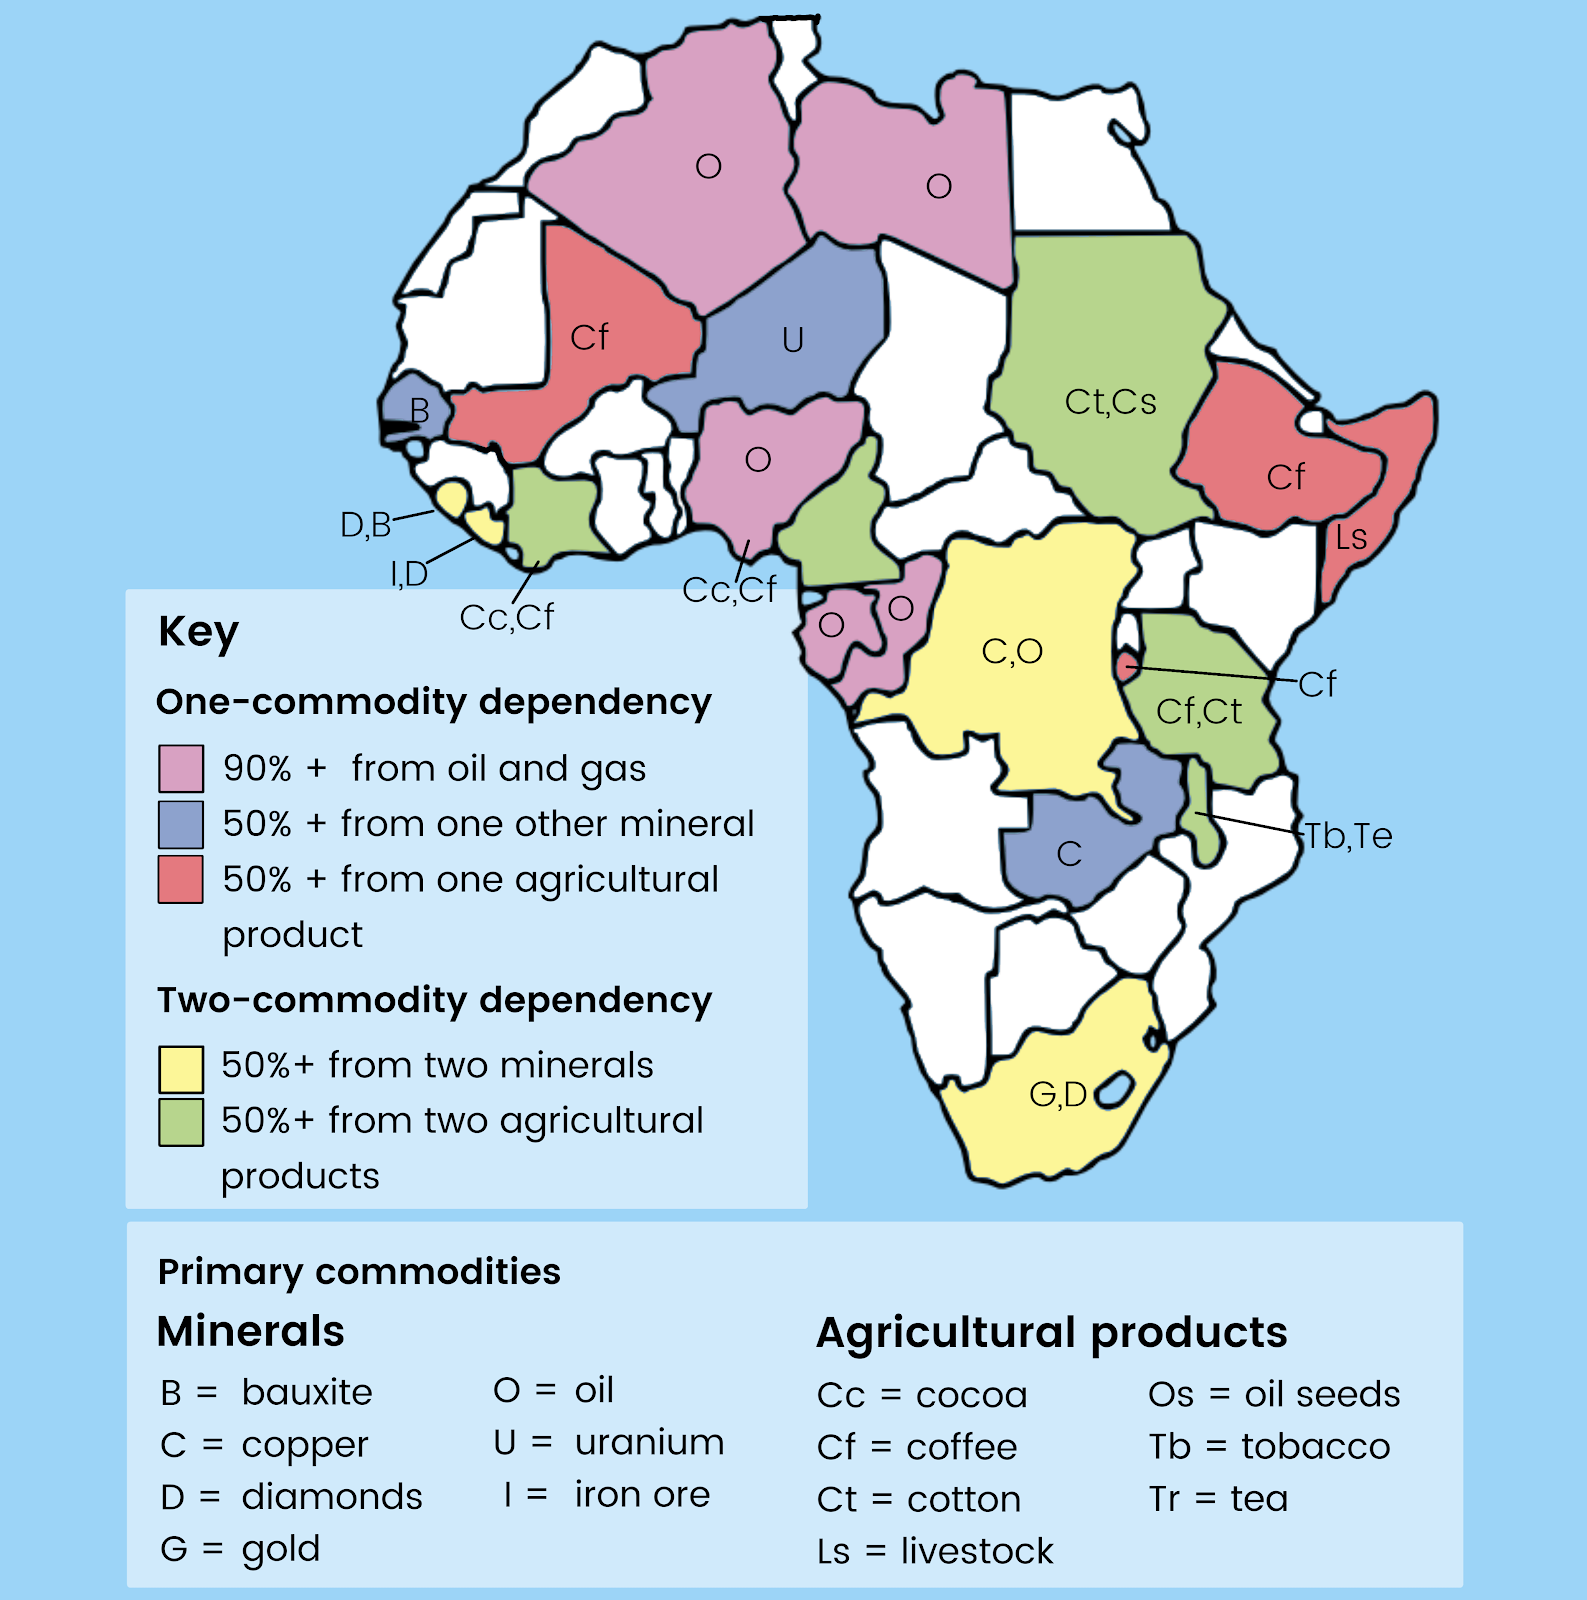
- LEDCs are over-reliant on one or two main exports, usually primary products; primary product dependency can be disastrous due to volatile markets (supply/demand and other countries producing the same product more cheaply), raw material exhaustion, crop failure and environmental hazards.
- MEDCs dominate and thus rig world trade; they subsidise their farmers who overproduce and then dump products on LEDCs, thus outcompeting them due to lower prices, they use tariffs to restrict market access for LEDCs, they force liberalisation by threatening LEDCs with stopping aid / demanding immediate debt repayment if they develop their infant industries by blocking MEDC exports and thus decreasing competition and they use regional trade agreements to increase their power whilst blocking LEDCs from utilising such strategies through the methods aforementioned.
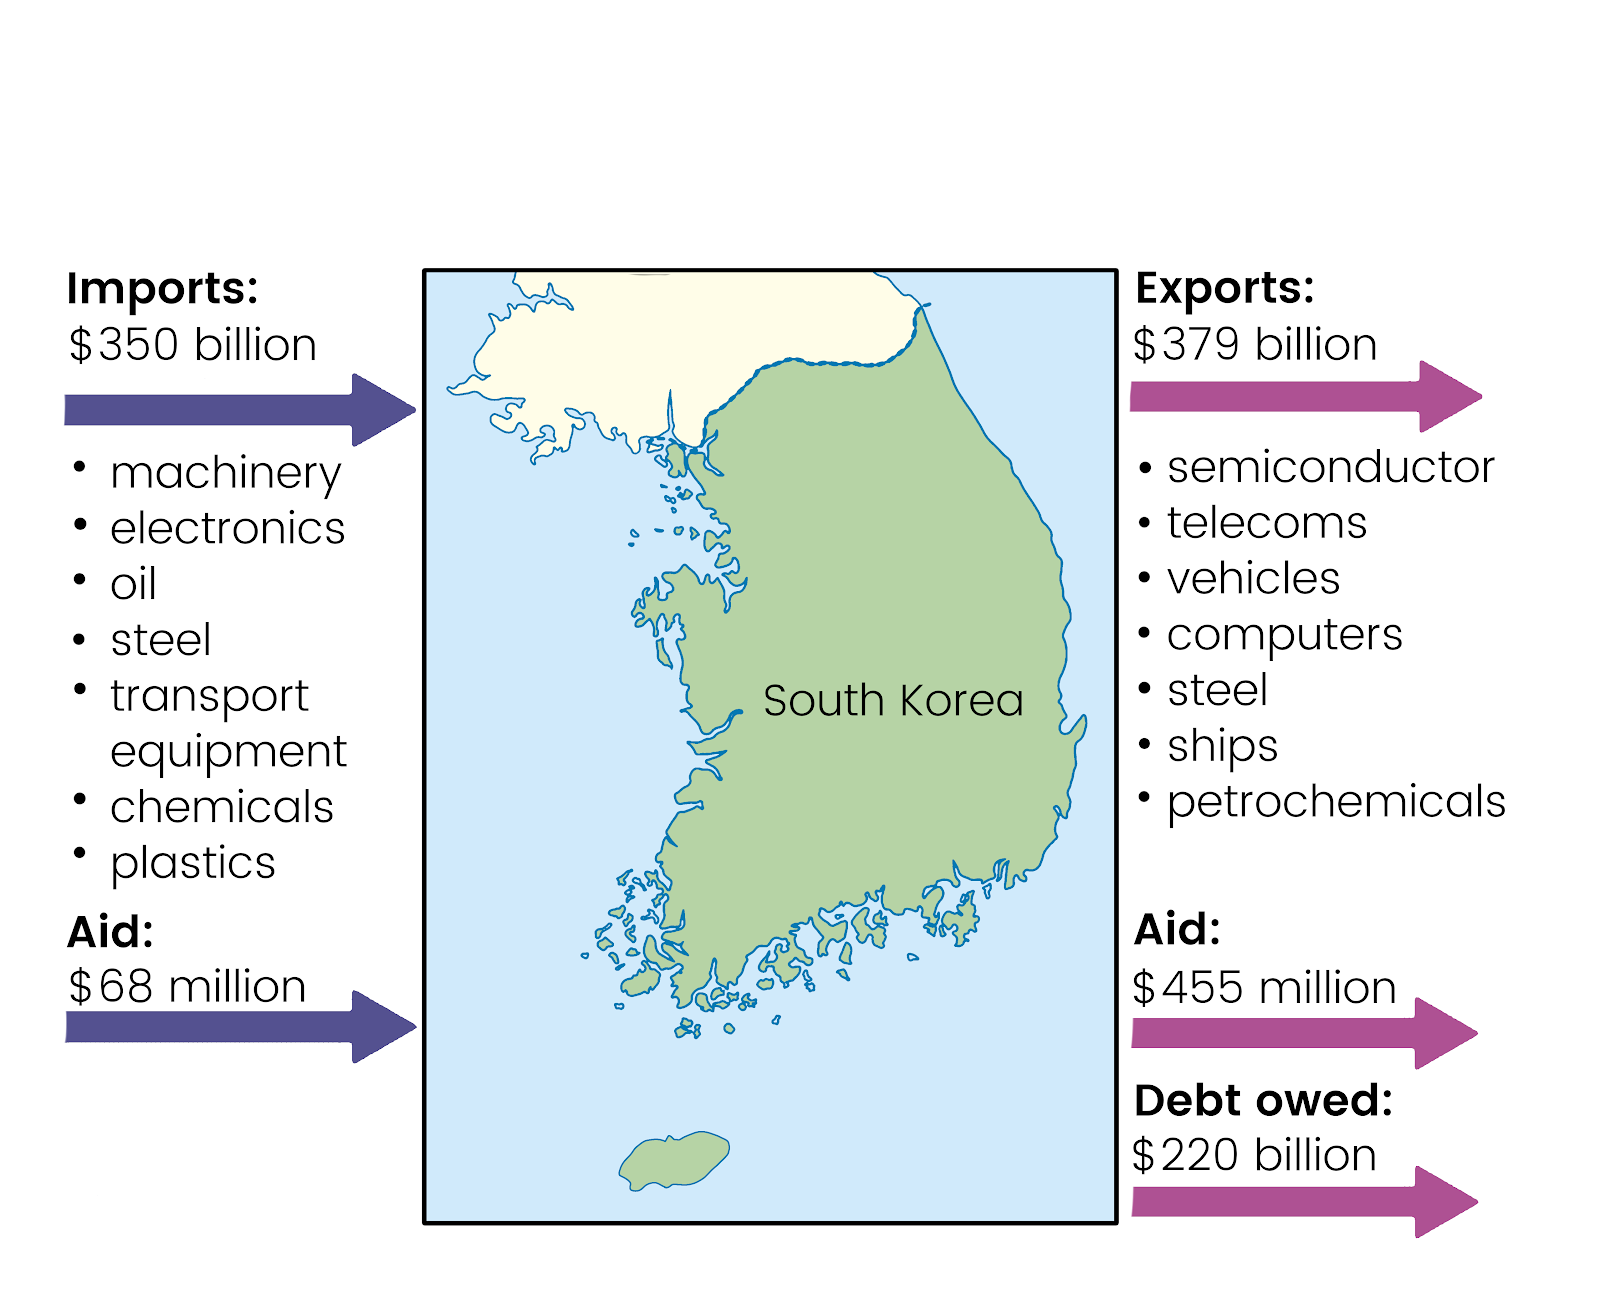
Case Study: South Korea
(import ban in 1990s to become an NIC).
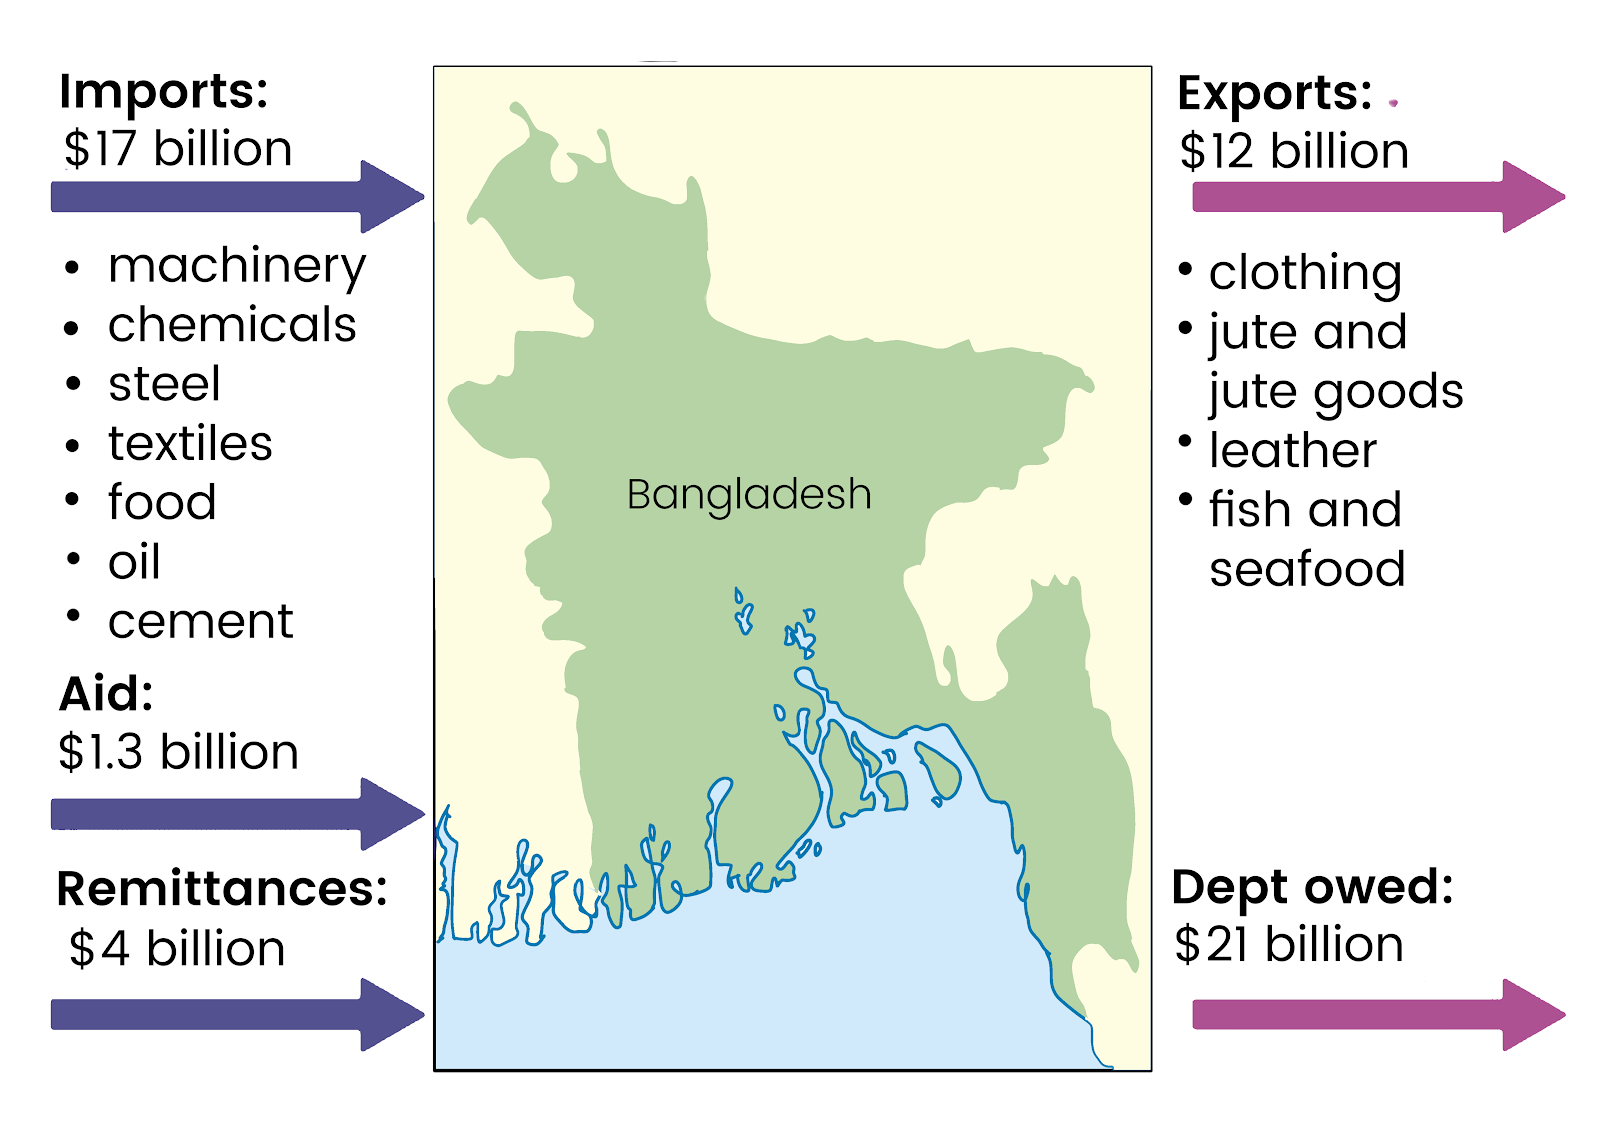
Case Study: Bangladesh
Environmental Factors
Landlocked countries such as the DRC are limited in their ability to trade due to restricted cargo ship access. However, the main environmental factors are natural hazards such as hurricanes, earthquakes, floods, tsunamis, tornadoes, volcanoes and drought.
- Drought affects food and water supplies and vegetation. It can be an inconvenience in wealthy countries like the UK, but in the worst affected parts of the world like the Sahel, drought can be a matter of life or death.
- Floods may cause severe property damage in developed countries but most lives are lost in the densely populated lowlands of developing countries. The poorest often live in the places most at risk.
- Hurricanes and cyclones affect tropical coasts. Island states, for example in the Caribbean, and delta regions like Bangladesh are the most vulnerable. Like other hazards, in developed countries, they often cause fewer deaths but more property damage.
- Earthquakes and volcanoes have less of an impact in developed countries because their buildings are built to withstand shocks, and they have better early warning systems. For example, in December 2003 two earthquakes, both 6.5 on the Richter scale, killed three people in California but 30,000 in Iran.
Case Study: Asian Tsunami (26th Dec 2004)
- 9.1 magnitude (Richter Scale) earthquake.
- 220,000 dead.
- 650,000 injured.
- 2m homeless.
- Infrastructure damage.
- Loss of tourism.
- Coastal fishing industry lost equipment.
- $4bn to rebuild Banda Aceh – debt?
- Soil & fresh water contaminated by salt.
What are the solutions to the Development Gap?
Development Schemes
In addition to improving crops through genetic modification, LEDCs could pursue infrastructure development schemes.
One option would be a top-down development scheme, but this large-scale project could be expensive, have a long construction time, require foreign, not local skills and investment, be unsustainable and inappropriate, cause corruption and only benefit TNCs/government/rich elite.
Case Study: Akosombo Dam, Ghana, Africa
- Cost £130m to build this HEP dam, for which Ghana paid 50%, and the rest came from bilateral aid from the UK / USA (and a small amount from multilateral aid through the World Bank).
- 660m x 114m dam built between 1961 and 1965, creating Lake Volta (the largest man-made lake worldwide) and providing electricity for Ghana and neighbouring countries.
- The electricity is rationed during droughts due to the use of the lake.
- 80% of electricity guaranteed for neighbouring USA Bauxite (Aluminium Ore) mine.
An alternative and preferable option would be a bottom-up development scheme as this small-scale project is low cost, contains simple and appropriate technology that is easy to fix and maintain, is sustainable development, involves the local community and benefits them to break the poverty cycle, uses local materials and knowledge and is usually run/funded by NGOs (non-governmental organisations, aka charities).
Aid
Aid is the transfer of money, goods and expertise from a donor country to a different recipient country; it may be given freely, as a loan or with conditions attached.
There are 3 types of aid:
- Bilateral aid – between two countries, often tied or conditional aid; often results in top-down prestige development projects and given for political reasons (e.g. UK / France give most aid to former colonies, and Israel is the single largest beneficiary from the USA).
- Multilateral aid – this is where governments give money to international agencies such as WHO (health), UNICEF (children), UNESCO (education) and the World Bank (development projects) who then decide how it is spent; pays more attention to need but large organisations are slow to change and often don’t solve the root problem.
- NGO aid – non-governmental organisation aid is given by charities (e.g. Oxfam, Christian Aid, Water Aid) based in and funded by MEDCs through public appeals, regular donations, charity shops and grants from governments who recognise their abilities to help; they work closely with communities to deliver targeted and effective aid usually in the form of bottom-up development schemes or humanitarian / relief aid.
There are 2 timescales for aid:
- Short-term aid – humanitarian or relief aid is given to offer a lifeline in emergencies created by human or natural disasters, usually in the form of NGO aid; it can take forms such as food, water filters, medical help, clothing, blankets and tents.
- Long-term aid – developmental aid is given to increase a country’s level of development; its form depends on the organisation but could include large-scale top-down development schemes, vaccination programmes, health education/family planning advice, sanitation facilities, clean water supplies, research into diseases, agricultural support/training/seeds, setting up organisations to represent local farmers and community projects (i.e. small scale bottom-up development schemes).
Case Study: Practical Action
This NGO helps to construct solar lanterns, renewable micro-hydro power, smoke hoods for fires and bio-latrines from which the locals can use the poo (slurry) for fertilisers and the methane gas as a fuel for heating, lighting and cooking.
Their long term developmental NGO aid is low cost, simple and appropriate technology, sustainable and bottom-up development.
Case Study: Water Aid
This NGO is based in the UK and aims to help the 1bn people who don’t have access to safe water through sustainable bottom-up projects that cost less than £15 per person.
- Rainwater harvesting schemes in countries with regular rainfall and limited surface water sources (e.g. Ethiopia).
- Gravity-fed schemes in hilly areas where water can be piped down to communities from higher water sources (e.g. Ethiopia).
- Hand-dug wells deep enough to ensure the water table can still be reached during the dry season with waterproof linings (e.g. Nepal); they can also improve existing wells which dry up easily.
- Water pumps to pump up water from the water table.
All the above schemes contain covered supplies with taps and filters to prevent the spread of disease. They are also simple technology constructed by the community with local materials; women also play an important role because they will benefit the most.
Water aid also provides sanitation facilities – often open plan to be child friendly (e.g. latrines in Indian slums such as Dharavi) – in addition to hygiene education programmes.
Trade
It is proposed that the WTO (World Trade Organisation) should regulate trade to create a fairer system of Free Trade with all 147 members having an equal say in its work, but in reality, this doesn’t work as LEDCs are less able to send representatives and any LEDCs who previously had RTAs with MEDCs suffer due to the loss of these.
LEDCs could be encouraged to set up trading groups (e.g. European Union (EU), North American Free Trade Agreement (NAFTA)) where they cut tariffs and make goods cheaper for members. However, uninvolved LEDCs will still lose out.
Free Trade is a scheme where local farmers join a local trading group which gives them a fairer price (thus slightly increasing the shelf price as the retailers still take a big share) with a minimum guarantee to cover costs even when world prices fall and protect their interests. It also allows producers to be in control and own the land / make their own democratic decisions, advocates decent working conditions with no child labour, aims to be environmentally friendly and offers a social premium to invest in local projects. Sales of Fair Trade products in the UK had grown yearly, worth nearly £500m in 2007.
Case Study: Banana Farms in the Windward Island, St Vincent, Dominica
This island was previously a UK colony and thus had a special trade agreement before the WTO’s free trade rules; this is a problem as TNCs in Central/South America can grow bananas cheaper using pesticides, larger plantations and labour exploitation (e.g. low wages). In 2000, they joined Fair Trade and now get a $1.75 bonus per box to invest in communities and better farming practices (e.g. not using pesticides). Now 5m fair trade bananas are sold yearly in the UK, where the average person eats 130 per year.
Case Study: Cocoa Farmers in Ghana
The price of cocoa has been falling for many years in contrast to the ever-increasing cost of living. As a result, farmers now earn less than £0.60 a day in a country where 1/4 of young children go hungry. The organisation Kuapa Kukoo has been established to represent local farmers to sell cocoa through the fair trade system, where the raw materials sell for twice as much.
Debt
Many poorer countries are in huge sums of debt and a thus classed as HIPCs (Highly Indebted Poor Countries). This is due to expensive infrastructure projects funded through conditional aid, doubling interest rates between the 1970s and the 1980s and unpaid interest added to original loan amounts due to unaffordable repayments. Therefore, investment in infrastructure, health, education etc., is restricted due to lack of available funding.
As part of the ‘Make Poverty History Campaign’, ‘Live 8’ concerts were held in July 2005 to highlight the problems of debt for HIPCs and thus promote cancelling it. Soon afterwards, the G8 signed an agreement to cancel debts owed by 18 HIPCs if they met the conditions of showing they were not corrupt and had good financial management and spending the money saved from repayments on health, education and poverty reduction.
Conservation Swaps or Debt for Nature Swaps agree to cancel part of countries’ debts if they use some of the money saved to pay for conservation projects to prevent overexploitation of natural resources, habitat destruction, environmental damage and loss of biodiversity. 50 countries have taken part in such schemes between 1987-2001.
Case Studies: Debt for Nature Swaps
- A North American conservation group took over $650,000 of Bolivia’s national debt in return for the government setting aside large rainforest areas as a protected nature reserve.
- Peru has agreed to a debt swap of almost $40m with the USA in 2002 and 2008 in return for undertaking conservation activities to preserve 27.5m acres of endangered rainforest habitat to save rare species such as jaguars and pink river dolphins.
Direct Action
This is where protest groups lobby the government for change.
Case Studies: Direct Action Groups
- Launched in December 2004, the ‘Make Poverty History’ campaign calls on the UK government to change the rules/practices of unjust trade, cancel debts and deliver improved/more appropriate/unconditional aid. Christian Aid has supported it.
- Aid agencies, trade unions, fair trade organisations and faith/consumer groups form the Trade Justice Movement, which argues that world trade is neither fair nor free for the developing world and that change is thus needed to improve this situation.
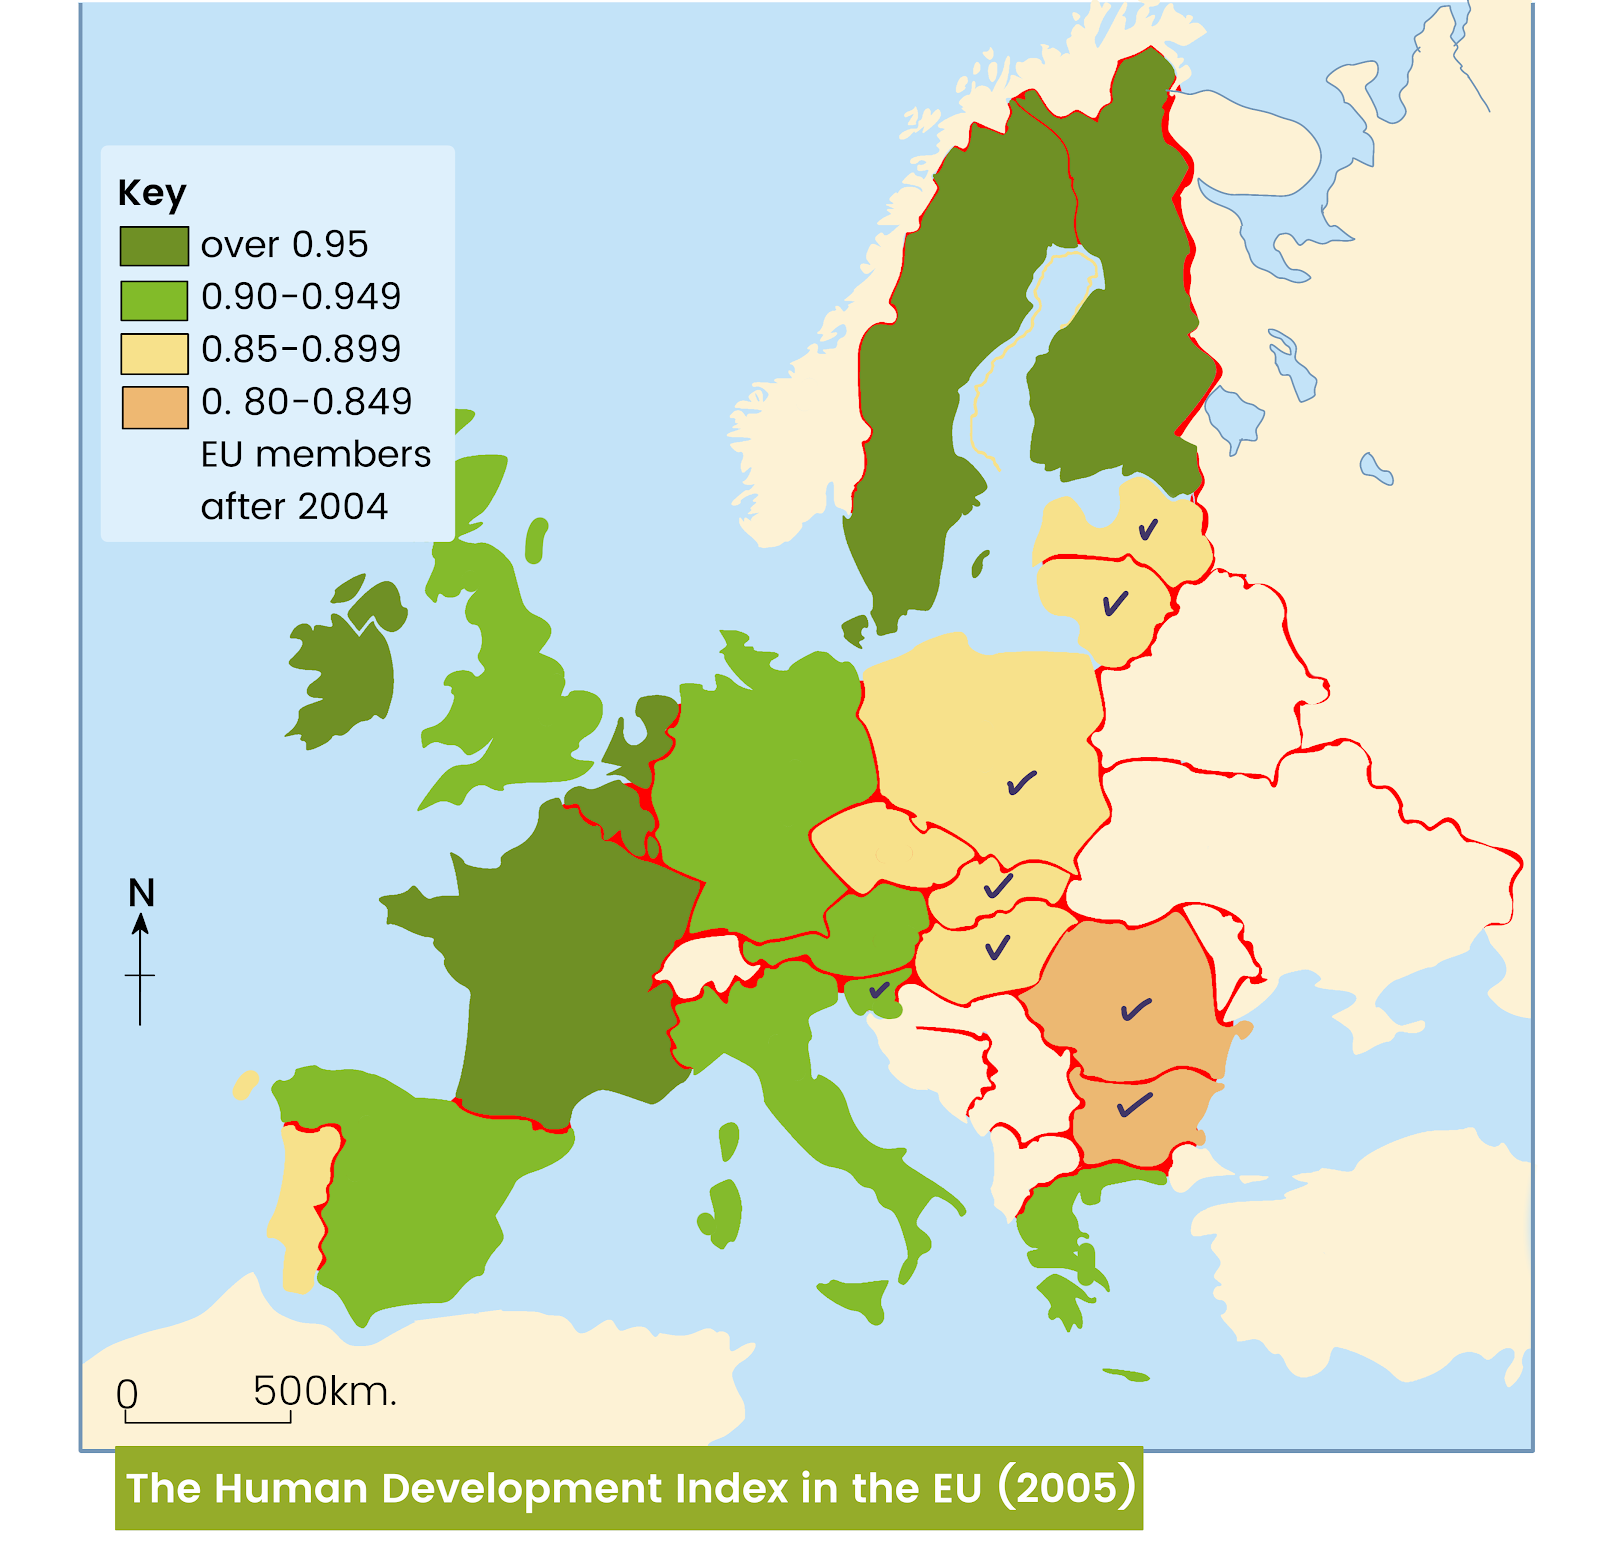
The Development Gap within the European Union (EU)
Even Europe has a development gap, with the Core at the centre being richer than the poorer periphery around the edge. This is shown in the HDI map on the left.
Case Study: European Core (Germany) vs European Periphery (Bulgaria)
Germany is in a trade surplus of $300bn whereas Bulgaria is in a trade deficit of $11bn:
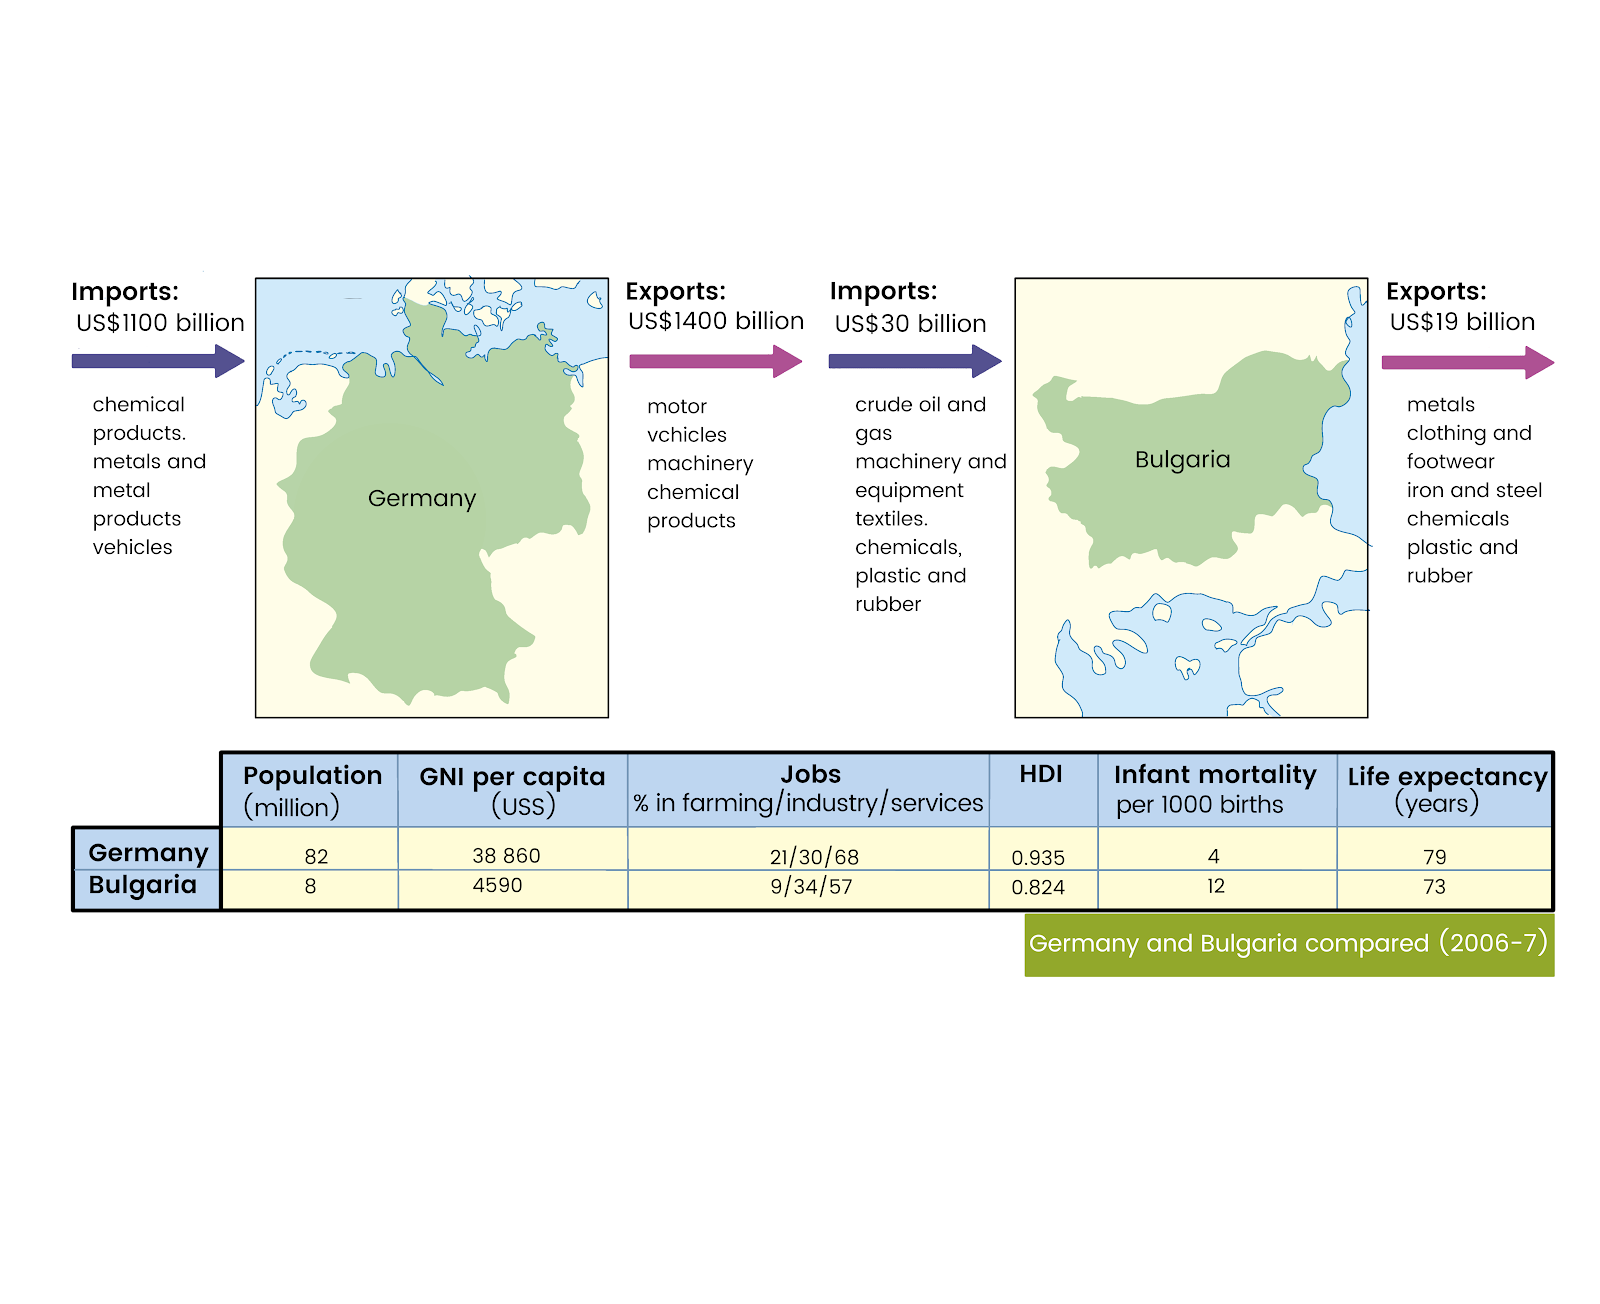
Countries such as Bulgaria and Romania with a communist history are less prosperous (with a GDP/capita of just 33% of the EU average and more than a third of the population living in poverty during early 1997) compared to historically capitalist countries such as the UK or Germany. The characteristics of core countries are major centres of growth, highly developed, urbanised, industrialised, political and financial centres and attraction for workers/investment/raw materials. Conversely, periphery countries have marginal locations, poor employment opportunities, lower living standards, primary sector dependence, limited urbanisation and high incidences of emigration.
Case Study: Prosperity in the Core (Germany)
Germany’s export-driven economy is performing strongly, especially through the motor industry and increasing demand from Asian countries – growing by 2.2% in just 3 months during 2010. This capitalist society is home to well-motivated workers with good work ethics, and thus with its many large-scale businesses, is ‘The European Economic Power House’. Trade is assisted by its coastline and position, meaning that all major international routes go through the country. Historically, the east of the country was much less developed than the west due to being behind ‘the Iron Curtain; but its development has improved through lots of governmental and commercial investment, including a fiscal stimulus package. Now the country is home to profitable, highly skilled manufacturing and is in a trade surplus due to focusing on producing only what consumers want. As a result, it is the world’s second-largest exporter, with $1.129 trillion exported annually.
Case Study: Problems in the Periphery (Romania)
Romania is old-fashioned, has limited mechanisation and has an agricultural economy based upon small-scale farming on highly fertile land within the ‘Wheat Basket of Europe’. The country also has high unemployment, very limited communications (old telephone network/reliance on ‘word of mouth’) and utilises traditional transport methods such as horse and cart. This is predominantly due to a history of Communism and Dictatorship where people lost motivation and thus put in little effort; during the period, intellectuals who could have threatened the system were imprisoned, thus limited advancement whilst there was limited youth education., The regime ‘destroyed’ the country due to lack of investment causing poor quality / unmaintained road networks, and poor water quality caused by an antiquated inadequate system of rusty pipes resulting in disease.
The European Union (EU) is an organisation set up to help close the development gap within Europe. It has its roots in the European Economic Community (EEC) set up in 1957, but the EU as we know it today was founded by the Maastricht Treaty in 1993. It currently consists of 27 member states home to over 500m citizens and accounts for 31% of global GDP. The organisation helps countries gain international status to rival the USA, Russia and China and requires stable democracy, human rights, a good economy and free trade (hence an RTA). There are also employment laws such as 4 weeks paid leave and lunch breaks to benefit citizens and aim to improve product standards by allowing you to return any broken products up to 2 years after purchase.
Each member state contributes 1% of their wealth to the EU budget (€130bn in 2008); thus, the wealthiest countries contribute the most (France + Germany = 40%). This money is then redistributed to aid development; over 1/3 is spent on regional aid for led developed regions and countries (e.g. South Wales received £1.2bn between 2000-2006 for regeneration, and Gateshead’s Millennium bridge was partly funded by the EU but this will now decline due to the EU leaders deciding that rich countries should get less and poor countries more). This is known as the Cohesion Fund, comprising the European Regional Development Fund (general infrastructure) and the European Social Fund (education, training and job creation programmes). Between 2000-2006, 70 urban areas received funding worth €728.3m to help 2.2m people and between 2007-2013 €350bn will be allocated. The European Investment Bank (EIB) is the bank that controls this allocation and can also borrow money from the rest of the world to fund further development when required.
The Common Agricultural Policy is a set of subsidies paid to EU farmers to ensure enough food is grown to feed the European population while ensuring minimum living standards through minimum pay.
Structural Funds are also used to improve infrastructure, often transport, to allow more efficient work. The regions targeted have a GDP/capita of 75% less than the EU average, and the funding aims to allow their development to catch up with the rest of the EU.
Glossary
Aid – the transfer of money, goods and expertise from a donor country to a different recipient country; it may be given rely, as a loan or with conditions attached.
Colonialism – the historical process of European Countries invading and conquering countries to control them for many years to provide resources for the empire.
Conservation Swaps – also known as debt for nature swaps; this is a deal reached between a country and a wealthier country to which it owes money where part of the debt is cancelled in return for conservation projects,
Development – level of economic growth in a country, to develop is to use natural and human resources to achieve a higher standard of living.
Development Indicators – this is a statistical way of comparing levels of development between countries.
Exports – products sold to other countries for money.
Fair Trade – providing better prices, working conditions and terms for farmers and workers in poorer countries; as a result, the farmers gain a better deal where prices paid are always higher than production costs to allow improved living standards and community investment.
Free Trade – equal trade between countries with all barriers removed.
GDP – gross domestic product, the total value of goods and services produced by the country in a year (per capita = per person).
GNP/I – gross national product/income; total value of goods, services and trade within a country in a year (per capita = per person).
HDI – human development index; a development indicator used to illustrate quality of life and standard of living using more than one development measure (life expectancy, educational attainment x2, GNP/capita PPP). It shows how people are benefitting from a country’s economic wealth.
HIPCs – highly indebted poor countries; a group of 38 countries with the greatest poverty and debt.
Imports – products that a country buys from another country to use.
NGO – non-governmental organisation; a charity independent from the government and thus fundraises to help others by giving aid.
NIC – a newly industrialised country; an LEDC that industrialised since the 1960s and thus has developed manufacturing industries very quickly, resulting in rapid export and GNP growth.
Quality of Live – how well a person in a country can enjoy living; it refers to economic, social, physical, political and spiritual well-being.
Standard of Living – a country’s economic wealth; often measured as currency ($).
Trade – the exchange of goods and services for money between countries.
Trade Balance – the difference between the value of a country’s imports and exports.
Trade Deficit – when a country gets into debt due to the value of their imports being greater than the value of their exports; usually due to exporting primary products *raw materials) and importing secondary products (manufactured goods).
Trade Surplus – when a country is in profit due to the value of their exports being greater than the value of their imports; usually due to importing primary products (raw materials) and exporting secondary products (manufactured goods).
Trading Groups – agreements between countries which allow free trade between all members.
Still got a question? Leave a comment
Leave a comment